When faced with market disruptions going forward, organizations can apply vital lessons from the COVID-19 pandemic, which caused significant economic disruption, pushing companies into crisis mode and prompting substantial changes in their operating and financing strategies. To prepare for the uncertainty, some companies began hoarding cash and suspended stock buybacks and dividends, saving more than $250 billion in 2020 (Davide Pettenuzzo, Riccardo Sabbatucci, and Allan Timmermann, “Outlasting the Pandemic: Corporate Payout and Financing Decisions During COVID-19,” CEPR Discussion Paper, May 1, 2021). A survey later that year revealed a notable decrease in capital spending plans. Other companies preserved cash for working capital needs that soon ballooned as sales dropped in the early months of the pandemic, while optimized supply chain systems profoundly failed in the ensuing months.
In the early months of the pandemic, with lockdowns in multiple states, many companies burned through cash as they were assessing their longer-term prospects that included weighing the cost savings of employee layoffs in the short term against the future costs of finding and training new hires after the pandemic eased. Although the lockdowns hit airline and cruise ship operators particularly hard, the effects of the pandemic reached beyond leisure and transportation into many other industries. Government interventions, such as the Paycheck Protection Program (PPP) and stimulus checks, prevented an economic collapse. Although the stock market recovered quickly, supply chain disruptions persisted, labor shortages continued, and companies had to reevaluate sourcing and inventory management.
In addition to seeking new financing and delaying capital expenditures, companies managed working capital accounts—such as inventory, accounts payable, and accounts receivable—to generate cash flows. A popular measure for gauging the efficiency of a company’s working capital management is the cash conversion cycle (CCC), which reflects the time it takes to transfer cash payments for purchases into cash collections from sales. The strategies of various organizations in different industries show how the CCC length and its determinants—days sales outstanding (DSO), days inventory outstanding (DIO), and days payable outstanding (DPO)—fared as U.S. companies persevered through the economic disruption caused by the pandemic.
Why CCC Matters
Management accountants should prioritize the analysis of their company’s CCC, as it provides valuable insights into operational efficiency and working capital requirements. A shorter CCC indicates a more effective use of working capital. Therefore, management accountants should proactively seek opportunities to reduce this metric whenever feasible. By closely monitoring and analyzing the CCC, they can assess internal performance, identify potential issues, and find practical solutions to maintain efficiency and ensure a healthy liquidity position.
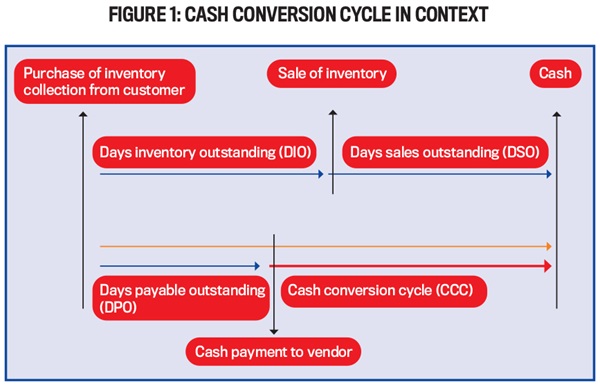
The CCC has three key components: inventory management, customer collection, and supplier payment (see Figure 1 for the CCC in this context). If any of these components underperform, it can adversely impact the business. For instance, retailers like Target, Walmart, and Kohl’s experienced inventory mismanagement in 2022, leading to negative consequences associated with excessive inventory buildup. Kohl’s, for example, witnessed a significant increase from year-over-year change in inventory of 1% in the third quarter of 2021 to 18% in the fourth quarter of 2021, 40% in the first quarter of 2022, and 48% in the second quarter of 2022, creating liquidity risks and operational challenges.
Source: Operating Cycle, CFI.
Management accountants can track the CCC over multiple quarters to evaluate whether the company’s operational efficiency is improving. If they observe an increasing CCC, they can delve deeper into its reasons, such as an increase in DIO. By identifying specific product lines or items that aren’t selling well, they can provide insights to upper management, enabling informed decisions. For instance, they might recommend discounting or disposing of slow-moving inventory.
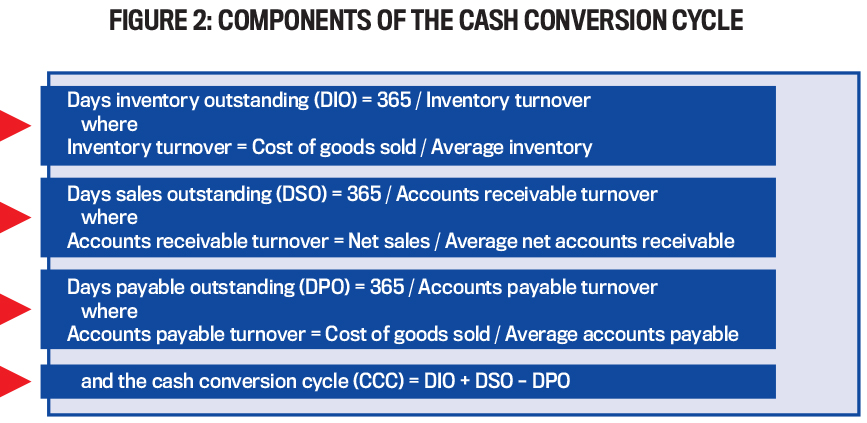
Comparing a company’s CCC with its competitors is also valuable for management accountants. Suppose the analysis reveals that the company has a significantly lower DPO than its peers. This information can be used as leverage in negotiating more favorable credit terms with suppliers. Access to suppliers’ capital essentially equates to interest-free funding for the company, enabling improved liquidity or additional investment in growth initiatives. Consequently, the calculation and analysis of CCC and its components empower management accountants to identify areas for streamlining operations and contributing value to their organization. See Figure 2 for the components of the CCC.
The outbreak of the pandemic in early 2020 had a profound impact on various industries. The focus here is on two familiar industries that were significantly affected: airlines and retail stores. During the initial months of the pandemic, media coverage highlighted deserted airports and empty stores, capturing the extent of the crisis. Our objective is to explore the measures taken by airline companies and retail stores to manage their cash positions and illustrate how the pandemic-induced disruptions affected their CCC.
Airline Examples of CCC Management
Leisure and business travel form the most significant part of the air transportation sector. With the arrival of the pandemic, both types of travel abruptly ceased. During the second quarter of 2020, air travel practically disappeared. The Payroll Support Program (PSP) authorized by the Coronavirus Aid, Relief, and Economic Security (CARES) Act of 2020 and the Coronavirus Response and Consolidated Appropriations Act (CRCA) of 2021 provided substantial economic aid totaling approximately $60 billion to airline companies. This assistance was crucial in preventing bankruptcies and providing a lifeline for airline companies to adapt their operations and manage their cash effectively.
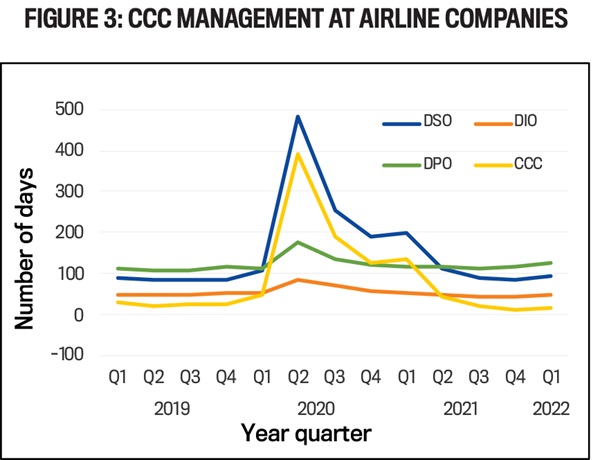
Under normal circumstances, airline companies may exhibit a negative CCC since passenger revenue is collected before travel. But due to the pandemic, passenger travel drastically declined, causing cargo transport and auxiliary services to become relatively more significant components of their operations. An analysis of 14 airline companies, including Delta Air Lines, Southwest Airlines, and American Airlines, revealed a notable trend. As air travel revenue plummeted faster than receivables, the average DSO skyrocketed from fewer than 100 days to nearly 500 days during the second quarter of 2020 (see Figure 3; quarterly calculations overstate the number of days by a factor of 4). As air travel gradually resumed in mid-2020 and increased in the fourth quarter, the DSO decreased to 200 days, which was still twice the pre-pandemic average. Eventually, by the second quarter of 2021, the DSO returned to the customary 100 days. This trajectory of DSO closely mirrored changes in the CCC over the same period, as increases in DPO nearly offset increases in DIO.
Delta represents major airlines with substantial domestic and international operations, while Southwest Airlines is a low-cost carrier primarily focused on domestic travel. How did the pandemic impact these two prominent carriers? Domestic travel resumed earlier than international travel, and these companies adopted distinct strategies for managing their CCC.
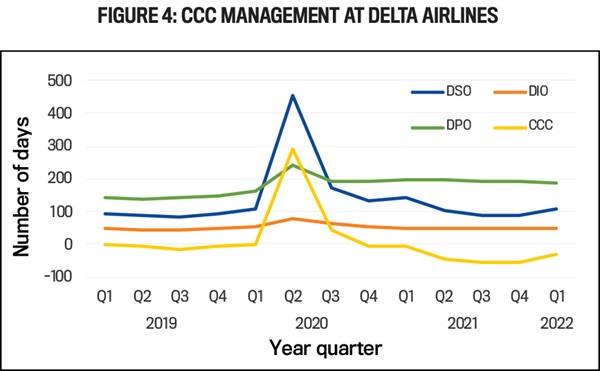
Delta experienced a significant decline in air travel revenue during the second quarter of 2020, dropping by approximately 95% compared to the same period in 2019 (see Figure 4). But its cargo revenue only decreased by 33%, providing some stability amid the pandemic. Delta’s situation mirrored that of the broader airline industry, struggling to manage its DSO but effectively increasing its DPO by leveraging its relationships with suppliers. As a result, Delta managed to reduce its CCC length from zero to -50 days by the end of 2021.
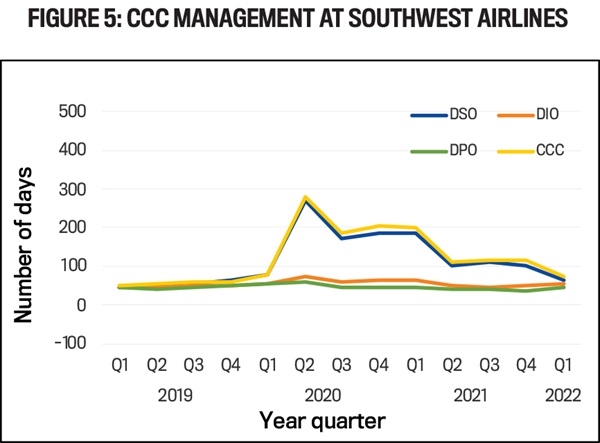
On the other hand, Southwest Airlines, about one-fifth the size of Delta in terms of pre-pandemic revenues, also faced a drastic 95% decrease in traffic compared to 2019 (see Figure 5). But unlike Delta, Southwest proactively raised cash during the second quarter of 2020 by issuing stock and debt to mitigate a substantial weekly cash burn. The graph demonstrates a spike in DSO and CCC length during the second quarter of 2020, reflecting the decline in air travel. Throughout the remainder of 2020 and 2021, Southwest maintained relatively high levels of DSO and CCC length. This indicates that Southwest had a more comfortable cash position than Delta and the airline industry overall. Additionally, Southwest’s DPO remained relatively low, as it didn’t face the same need to preserve working capital or negotiate better credit terms with suppliers.
Lesson for accountants: Access to suppliers’ credit is vital for effective liquidity management. Companies like Delta can depend on their relationships with suppliers to navigate liquidity challenges during times of crisis. On the other hand, companies that are unable to negotiate improved credit terms with suppliers, such as Southwest, due to size or other factors, should establish an emergency liquidity plan. This plan should encompass various strategies, including the possibility of issuing equity or debt. By understanding a company’s influence over its suppliers, accountants can develop more efficient contingency plans to address a crisis.
Retail Examples of CCC Management
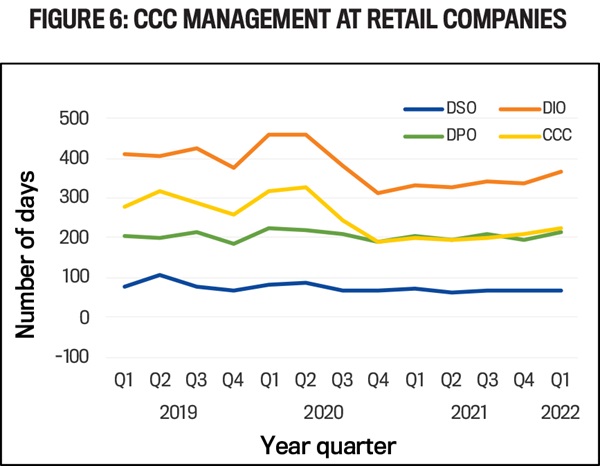
Unlike airlines, many retailers experienced significant customer traffic through their online channels during the lockdowns. Analyzing the graph for 164 retailers, including Kroger, TJX Companies, Best Buy, Kohl’s, and Home Depot, we observe that their DSO didn’t spike like it did in the airline industry (see Figure 6). Retailers predominantly receive cash or credit card payments, resulting in lower accounts receivables, and the impact of lockdowns on sales didn’t have a major effect on their DSOs. But due to reduced sales, retailers held onto their inventory for a longer duration, causing their average DIO to increase from approximately 400 days in 2019 to more than 450 days in early 2020 (quarterly calculations overstate the number of days by a factor of 4).
With the introduction of government stimulus checks to consumers, sales gradually returned to previous levels by the end of 2020. These liquidity injections led to frequent stockouts as supply chain disruptions affected inventory levels. The average CCC trajectory closely followed the DIO trajectory, and retailers successfully reduced their CCC and working capital requirements.
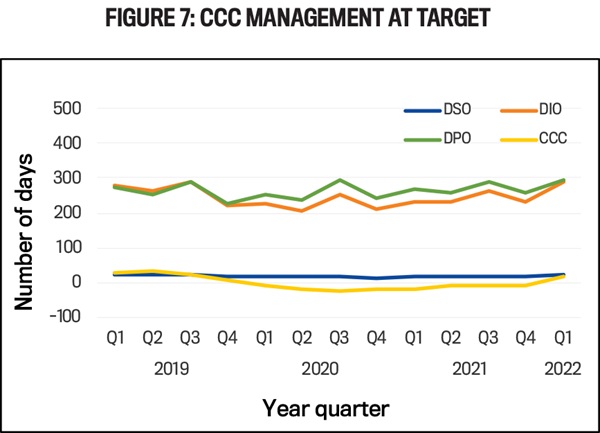
Target, a company selling consumer staples and a wide range of other consumer goods, and Home Depot, a home improvement store that experienced increased customer traffic during the pandemic (see Figure 7 and Figure 8, respectively), highlight the contrasting effects of the pandemic on different sectors of the retail industry. Due to the pandemic, people transformed their homes into makeshift schools or offices, leading to increased spending and high revenue but low inventory for Home Depot. In contrast, Target’s consumer goods inventory is highly seasonal, evidenced by the repeated inventory buildup during the third quarter and the sale of said goods during the fourth quarter.
The graph shows fluctuations in the DIO curve for Target, indicating restocking challenges. The delayed unloading of container ships caused Target to increase its orders in late 2020, and these were slowly delivered throughout 2021 due to supply chain congestion. In 2022, Target faced the issue of managing late-arrival inventory amid changes in consumer demand. Fortunately, Target’s size allowed it to postpone payments to vendors, improving its DPO and maintaining a stable CCC length during that period.
Home Depot’s DIO curve significantly dipped in the second quarter of 2020. Out-of-work homeowners or individuals working from home utilized their stimulus checks to undertake home improvement projects, benefiting Home Depot. Concurrently, the DPO curve improved by approximately 50 days in the latter half of 2020. These factors combined to reduce Home Depot’s CCC length by more than 100 days for nearly 12 months after the start of the pandemic (quarterly calculations overstate the number of days by a factor of 4).
Lesson for accountants: Inventory management is the apparent driver of CCC for retailers because their DSO and DPO curves are relatively stable. Together with the purchasing department and suppliers, the management accountant plays a significant role in inventory management. For instance, Home Depot’s accountants can act as “voices of reason” to mitigate or prevent the bullwhip effect caused by overestimating demand.
By recognizing that the surge in demand during the early stages of the pandemic, driven by employees working from home, was likely a temporary occurrence that included projects brought forward from the future, accountants could have adjusted expectations for future demand. Consequently, as the sample period progressed from the second half of 2021 to the end, Home Depot’s DIO (and thus its CCC length) returned to pre-pandemic levels and increased. This inventory accumulation was not unique to Home Depot but affected other retailers such as Target, Walmart, and Kohl’s, prompting significant discounts to clear excess inventory. While each crisis differs, accountants can learn from the inventory management challenges many companies faced during the pandemic to better prepare for future unique crises.
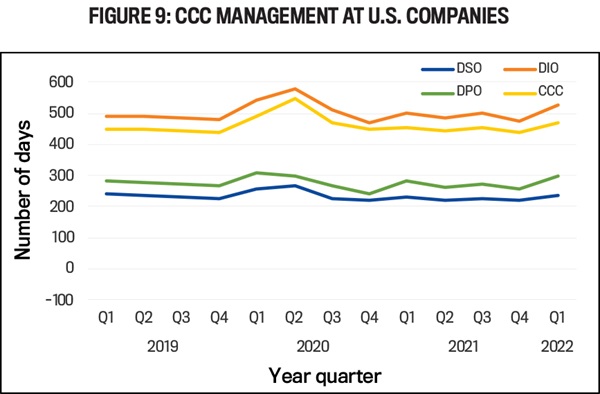
These examples aren’t isolated cases. They’re representative of an overall trend. An analysis of publicly traded U.S. companies reveals a similar pattern in CCC, where most companies experienced an initial increase during the peak of the pandemic in 2020 but were able to recover and return to pre-pandemic levels. Consequently, our observations likely apply to countless companies across various sectors of the American economy (see Figure 9).
The pandemic prompted many companies to revisit an effective cash preservation tool: managing their CCC. The resilience of two key industries—airlines and retailers—that play a crucial role in the consumer-oriented U.S. economy show how organizations can take different approaches to successfully restore their CCC to pre-pandemic levels by implementing appropriate management strategies specific to their circumstances.

September 2023


