This challenge becomes increasingly critical as accounting and finance departments strive to make more data-driven decisions. Our performance measurements are unlikely to be perfect, so we need a mechanism that aligns performance with the organization’s true goals.
Key performance indicators (KPIs) foster continuous improvement by giving managers needed data to assess performance, allocate resources, and guide strategies. When there are incentives attached to meeting target KPIs, however, you may see biased behavior. For example, a company looking to track and improve the quality of its IT help desk service may opt to measure the individual performance of its IT technicians by the number of tickets closed per shift. As a result, the technicians sometimes “cherry-pick” the easier tickets and the more difficult issues stay in the queue much longer, sometimes for weeks. The technicians focus their efforts on improving their score on the imperfect performance metric rather than improving overall performance.
This form of gaming the system is known as operational distortion (see “What Counts and What Gets Counted,” by Robert Bloomfield, SSRN. It occurs any time employees focus on increasing a measure of performance (e.g., number of tickets closed per shift) rather than performance (e.g., fast, reliable resolution of all technical issues). Recent research has shown that including narrative reporting—an explanation for choices or decisions—can reduce operational distortion and provides us with a guide to reducing operational distortion and the likelihood that employees will believe that the performance measure is “reality” (see “Decreasing Operational Distortion and Surrogation through Narrative Reporting” by Jeremiah Bentley in the May 2019 issue of The Accounting Review).
Let’s take a look at some of the issues and unintended consequences of gaming the performance measurement system, Bentley’s experiment showing the effect of including narrative reporting, and some advice on when and how to make narrative reporting work in your organization.
GAMING THE SYSTEM
We live in a data-driven world. Decisions are easier to make and communicate when we have data to support those decisions. Quantitative data is especially easy to accumulate and track. In this increasingly dashboard-oriented environment, it’s instructive to remember this abridged version of Campbell’s Law: “The more any quantitative indicator is used for decision making, the more subject it will be to corruption pressures and the more apt it will be to distort and corrupt the processes it is intended to monitor.”
Campbell’s Law means that the more we focus on KPIs, the more likely we’ll motivate people to “manage the measure” instead of improving real performance. Thus, the measure itself will be less useful for assessing real performance.
Let’s think about the help desk example again. Management’s goal is to improve the quality of service provided by the technicians. While resolving problems quickly is a key aspect of service quality, it doesn’t capture all aspects of service (e.g., complexity of the task, experience with the issue, online help available, interpersonal skills, etc.). Evaluating the performance of technicians by the number of tickets closed motivates them to manage this measure by distorting reports or by distorting operational activities.
Reporting distortion occurs when someone misreports the raw data used in a KPI. For example, a technician could report cases closed that weren’t actually closed (or that never existed in the first place). Operational distortion occurs when someone changes their behavior to improve the KPI result without improving results on the true objective. Closing the easiest cases may improve the measure without a corresponding improvement in the overall quality of service. Instead, the technician’s action sacrifices some users in need of help in order to focus on others who can be helped quickly.
To make things worse, technicians and their supervisors may actually come to believe that they’re doing what’s best for the users and the company, a phenomenon called surrogation. Surrogation occurs when people get so caught up in a measure that they forget that there’s a difference between the measure and the ultimate performance objective (see “Lost in Translation: The Effects of Incentive Compensation on Strategy Surrogation,” by Willie Choi, Gary Hecht, and William Tayler, The Accounting Review, July 2012). For example, technicians may convince themselves that the number of tickets closed is paramount, disregarding the importance or urgency of more difficult tickets in favor of quick, easy tickets.
Operational distortion reduces the credibility of performance assessments and results in unintended consequences. In the IT example, management should be concerned that the focus on easy tickets can lead to dissatisfied clients and a reputation for only being able to solve the easy problems, while clients with more technical needs will ultimately choose a new service provider.
UNINTENDED CONSEQUENCES
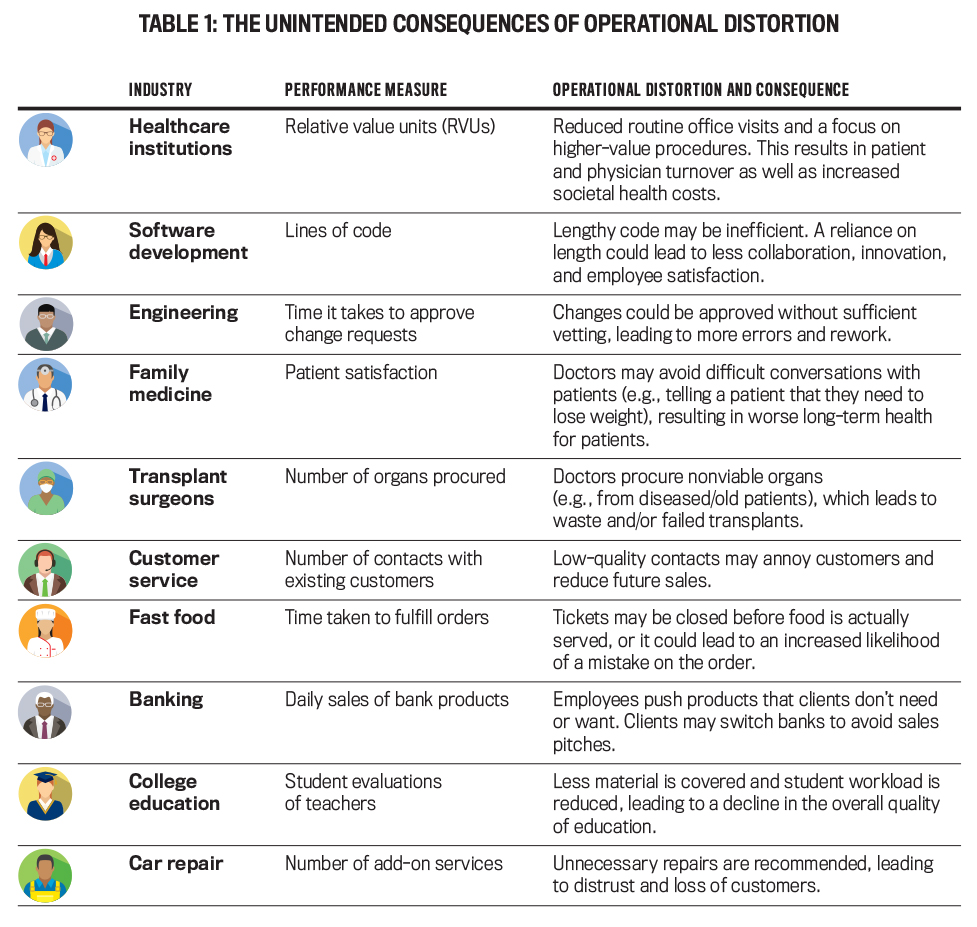
Operational distortion (and any resultant surrogation) can have far-reaching negative effects on an organization. To illustrate the potential impact, we compiled several examples of operational distortion and their unintended consequences that we’ve encountered in our own experiences or that business professionals shared as part of a graduate class (see Table 1).
Click to enlarge
Consider the healthcare industry. Relative value units (RVUs) are a common metric used to measure physician productivity in the United States—including in the Medicare reimbursement formula. Most medical procedures are assigned an RVU. High-RVU procedures require more time, effort, and expenditures than low-RVU procedures. Because physicians have incentives to report high RVUs, they’re motivated to reduce routine office visits (which have a low RVU) and instead focus on costlier procedures. This can lead to several unintended consequences:
- New patients can’t get appointments and instead move to other healthcare systems, reducing revenue.
- Physicians become motivated to recommend extra tests and procedures, which increases societal healthcare costs.
- The use of RVUs as an evaluation metric creates resentment among physicians and leads to increased turnover.
Another example comes from software development. A software company opted to measure the performance of each of its programmers based on the number of lines of code they wrote. As a result, the team members were motivated to write lengthy code, even if it had bugs, ran slowly, or was otherwise inefficient. In addition, team members stopped collaborating and helping each other out so they could focus on and improve their own KPIs. The result was longer project completion times, less efficient programs, and less knowledge transfer. The work was less satisfying for the employees, and the organization missed out on innovative approaches to the process and the project.
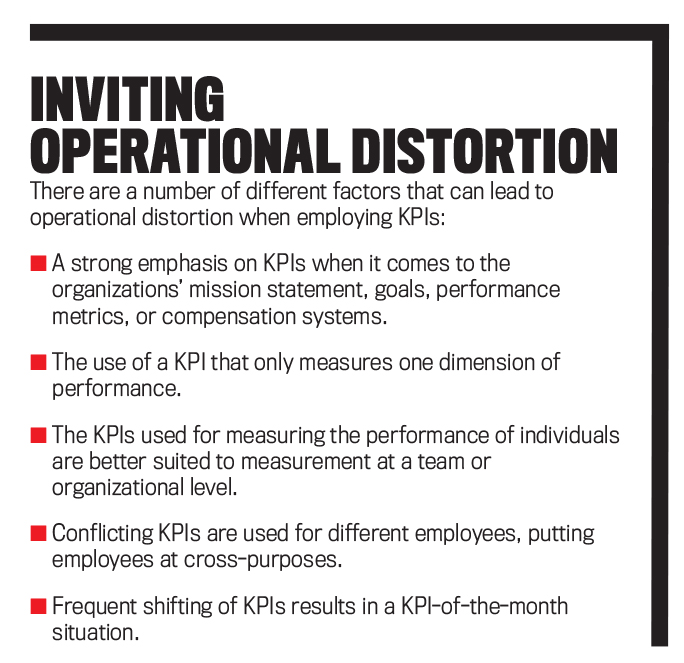
There are KPI factors or characteristics that can exacerbate operational distortion (see “Inviting Operational Distortion”). Operational distortion can hurt your organization by decreasing employee collaboration and efficiency, increasing employee turnover, and shifting the focus away from creating true value.
How can you avoid or reduce these negative consequences? In the example about improving IT service quality, management turned to narrative reporting. Technicians sent out short reports explaining what they did that day. Those reports provided an opportunity to justify a low ticket-closure metric with an explanation (e.g., “I was working on a complex ticket that required my unique qualifications”). With narrative reports supplementing the KPI, the technicians no longer felt the need to focus on the easy tickets.
THE RESEARCH
To test the evidence that narrative reporting would reduce operational distortion, Bentley created a lab experiment where, similar to the real-world situations we’ve described, performance was measured imperfectly and employees had an opportunity to distort operational decisions.
The experiment revolved around the game of chess, which provides a rich environment for studying operational distortion because there’s both a simple, objective measure and a more complex measure that indicate the probable outcome of each game:
- The simple measure, material count, is based solely on the pieces remaining on the board, ignoring where those pieces are positioned.
- The more complex measure, engine score, incorporates material count and also accounts for the strategic positions of the pieces, such as whether one player has control of the board or has a better defense structure.
While engine score is a better indicator of who’s actually winning a chess game, material count is used more often simply because it’s so much easier to measure—much in the same way managers often use simpler measures of performance (e.g., number of tickets closed in a shift) because ideal measures (e.g., quality of service) are impractical, expensive, or hard to quantify.
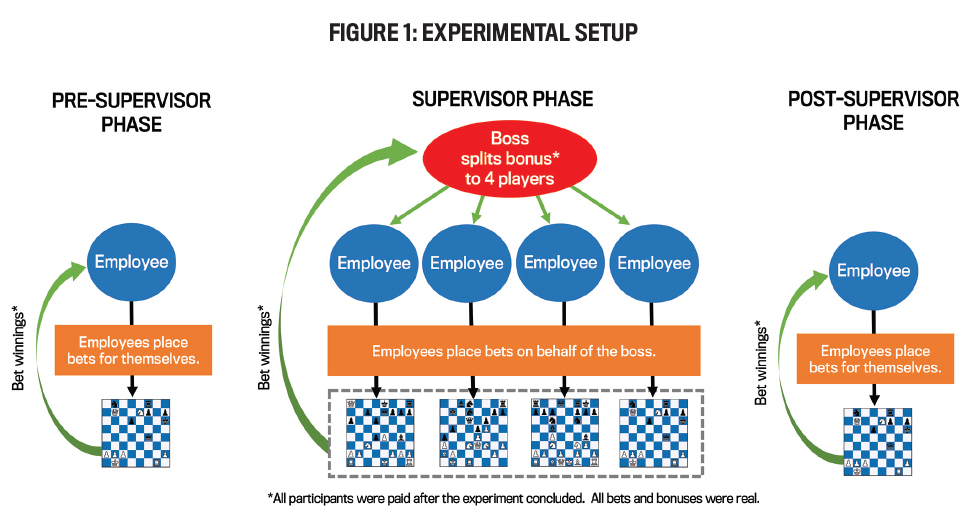
In the experiment, experienced chess players were assigned to a role as an employee or a boss. In each phase, employees studied 10 chessboards and their corresponding material count. After evaluating each board, they placed a bet on whether they thought white or black would win the game. For each game, all employees wrote a few sentences explaining why they made a particular bet. Figure 1 summarizes the three phases of the experiment:
- In the pre-supervisor phase, the employees placed the bets on their own behalf.
- In the supervisor phase, the employees placed their bets on behalf of their boss. The boss then evaluated a group of four employees’ bets at the same time and split a bonus among them.
- In the post-supervisor phase, the employees once again placed bets on their own behalf.
 Click to enlarge
During the supervisor phase, participants were split into two groups. One group knew that the boss would see their explanations (narrative group). The other group knew the boss wouldn’t see their explanations (no narrative group).
The boss received a report containing material count information along with the employees’ bets. The boss didn’t see the board, the engine score, or the eventual outcome of the game. To determine the bonus allocations in the no narrative group, the boss had to rely solely on material count for the evaluation. In the narrative group, the boss also received the explanations of the employees’ betting decisions.
The study measures operational distortion and surrogation by comparing the bets placed on different games. In some games, one side had a decisive advantage due almost entirely to material. In other games, one side had a decisive advantage due almost entirely to strategic positioning. Consider the following two games:
- Material Advantage Game:
- Strategic Advantage Game:
Note that the games have nearly identical engine scores. Experienced chess players should place very similar bets on the two games. If someone places a larger bet on the material advantage game than the strategic advantage game, they’re exhibiting a bias toward the imperfect measure (material count). Accordingly, the study measures bias as the average bet on material advantage games minus the average bet on strategic advantage games.
If employees increase bias in their betting behavior from the pre-supervisor phase to the supervisor phase, this is evidence of operational distortion. Employees respond to the performance measure by giving it their attention and adjusting their behavior. In Figure 2, we see that the supervisor bar is higher than the pre-supervisor bar in the no narrative group. This suggests that employees in the no narrative group engaged in operational distortion. They changed the way they made bets when a boss evaluated them. Specifically, they placed much larger bets on material advantage games than on strategic advantage games. Remember, these employees couldn’t explain their bets to their boss.
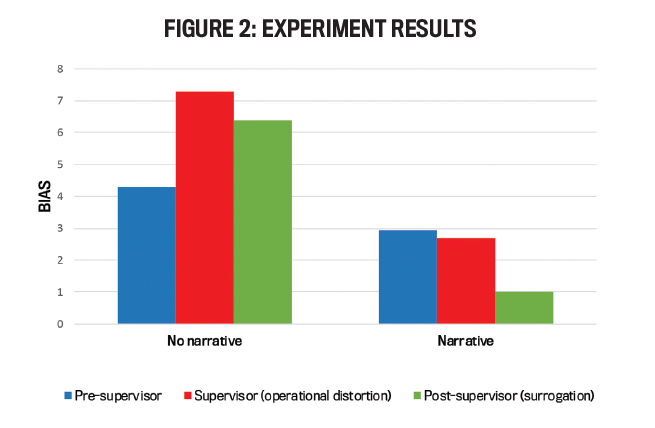
In contrast, employees in the narrative group kept betting as they had before the supervisor phase. The pre-supervisor and supervisor bars are similar in height. The participants generated the same amount of value for their boss as they did when they were betting for themselves. The opportunity to explain their decisions reduced the operational distortion.
If employees don’t revert to pre-supervisor levels of betting after the supervisor phase, this indicates surrogation. After removing the pressure to impress a boss with their performance on an imperfect objective measure, all employees should have simply made the bets that would have provided the biggest payout in the post-supervisor phase. Yet those in the no narrative group still systematically biased their decisions toward material count and ignored important unmeasured aspects of the game, such as strategic positioning. The post-supervisor bars in the no narrative condition haven’t returned to similar levels as the pre-supervisor bars. This shows that they engaged in surrogation by coming to believe that the objective measure was more reflective of reality than it actually was. Those in the narrative group, on the other hand, didn’t engage in surrogation.
The finding of surrogation is especially problematic in the real world as it means that it’s very hard to remove the bias once incentives have been put in place. People come to believe in the distortion they were engaging in, and the “focus on the measure” attitude becomes ingrained in the organizational culture. The problem could compound even further when employees get promoted and reinforce the culture that the measured variable is what really matters.
CAN NARRATIVE REPORTING HELP YOU?
This research provides evidence that narrative reporting is an effective tool to reduce operational distortion and surrogation. It gives employees an opportunity to explain how a KPI may not fully capture the value of their activities. Employees can justify their actions and explain how those actions contribute to the organizational goals, even if the KPI doesn’t completely reflect that contribution. When employees understand that the narrative reports will be used as part of the performance evaluation, they’re less motivated to game the performance measure for favorable evaluation. Instead, they can focus on maximizing behaviors that contribute to the long-term health of the organization.
Narrative reporting provides several other benefits as well. First, supervisors have additional information and may gain insight into the actions and rationales of the employees. If the narrative report captures information about additional dimensions of good performance, the supervisor can consider that information in the evaluation.
Second, the information in narrative reports may identify opportunities and issues that aren’t captured by any KPIs. For example, a narrative report might identify an innovative approach that you should consider for implementation in other parts of the organization.
Third, because it can reduce operational distortion, narrative reporting can reduce the “noise” around KPIs, which increases the usefulness of those measures. In their Strategic Finance article “The Perils of KPI-Driven Management,” Kevin Kaiser and S. David Young argue effectively that measure management can erode the value of KPIs as a tool that promotes organizational learning. Narrative reporting allows a more holistic reporting of performance and can contribute to a culture focused on creating long-term value.
Finally, narrative reporting can be particularly valuable when organizations are introducing new KPIs or making changes to incentive systems. The reports will help you identify potential weaknesses in the evaluation system, such as important dimensions of performance that the KPIs don’t capture. It may also make the change less painful to the employees as they can explain issues with the performance measures that bother them.
MAKING NARRATIVE REPORTING WORK
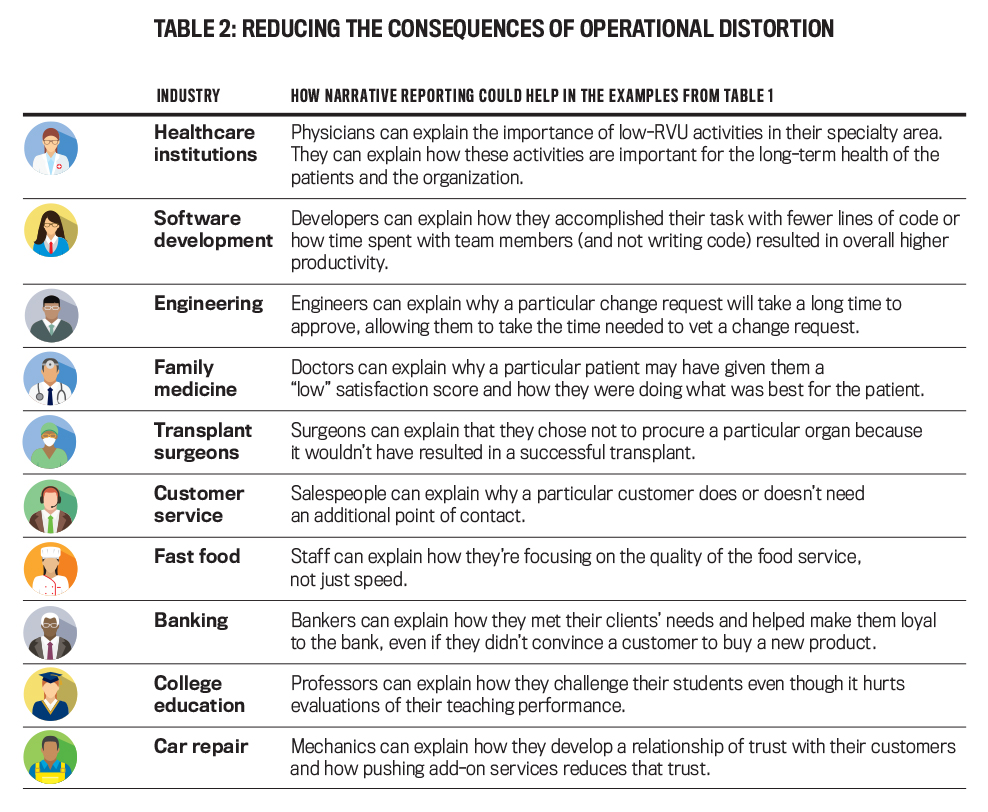
Table 2 revisits the examples of operational distortion from Table 1 and shows how narrative reporting could enable people to justify actions that are part of “good performance” but not captured by a KPI.
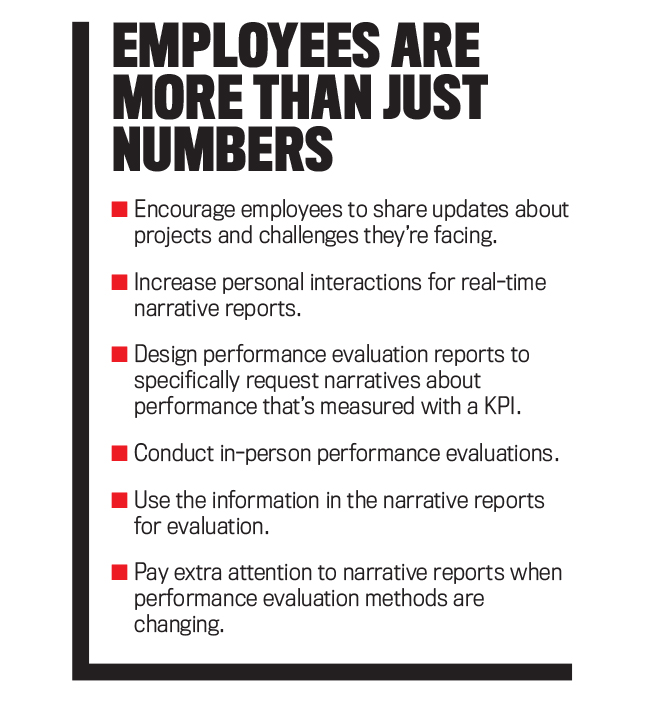
< Click to enlargeOf course, the benefits of narrative reporting come at a cost. Employees will need to spend time preparing the narrative reports, and supervisors will need to spend time evaluating those reports. Yet even if continuous narrative reporting is cost-prohibitive, you should consider the potential benefits of a limited implementation, especially when you introduce new evaluation systems. There are many ways to collect and use narrative reports to demonstrate to employees that there’s more to their performance than just numbers (see “Employees Are More than Just Numbers”).
The amount of data available for analysis is growing at an unprecedented rate. Data analytics is all the rage, and it’s easier than ever to measure quantitative performance. Yet when quantifiable information doesn’t capture all that matters, employees may game the system by distorting operational and reporting decisions—sacrificing company value in order to improve reported performance. The solution is to encourage narrative reporting. When employees talk about their performance, managers are finally able to get the performance they want, not just what they measure.

March 2020

