Within this role, the use of technology to assist decision making will become routine, but these professionals will be increasingly challenged to use analytics to move from traditional roles of oversight and hindsight to foresight and can serve as catalysts for change by anticipating the future and helping their companies navigate a path to the future they envision.
The need to use technology to aid decision making dovetails with the IMA® (Institute of Management Accountants) definition of management accounting as well as the IMA Management Accounting Competency Framework. The definition of management accounting identifies the use of financial reporting to partner in decision making and assist in the formulation and implementation of an organization’s strategy. The Competency Framework identifies data analytics as the use of enabling technologies to gain insights, improve predictions, and support decision making.
In the Big Data era, these perspectives offer a renewed challenge that our technological mind-set as accountants must look beyond the traditional view that accounting data is historical. Indeed, PricewaterhouseCoopers reports in its 2016 global industry survey that while 83% of respondents expect data to have a significant impact on their decision making in five years, only about half are currently using data to drive decisions.
As Raef Lawson points out in an August 2018 Strategic Finance article (bit.ly/2WkoQgH), “Accounting and finance professionals have at their disposal vast amounts of data that can be exploited to create value for their organizations.” Thus, technology can no longer be used to support only hindsight judgment but must be used as a data analytics tool to aid decision making with foresight judgment.
Where better to start moving your line of sight than with your company’s asset management? As a massive investment, tangible assets are a lifeline of the business—used every day to generate profits, encourage employees’ productivity, and make businesses more competitive. From manufacturing facilities and equipment to office furniture and computers, these assets touch every employee. And few businesses can operate without assets. In fact, analyzing data from over 35 years shows that fixed assets represent one of a company’s largest investments, constituting 39% of total assets.
The value proposition of moving your line of sight for asset management begins with integrating data analytics into your own asset management efforts. Our goal is to help the CFO organization move from an analyst to a catalyst in the business specifically by embracing data analytics—aligning the company’s assets with its strategic direction for more effective decision making.
CAPITAL INVESTMENT AND ASSET MANAGEMENT TRENDS
Table 1 highlights the new landscape of PP&E (property, plant, and equipment) with trends on assets by classification. While buildings, land, and improvements constituted one-quarter of PP&E in the 1980s, this proportion has declined to under 15%. These assets are durable, with life spans ranging from 20 to 40 years. In contrast, machinery, equipment, and computer hardware/software have become more prevalent since the tech boom. These investments constituted less than two-thirds of PP&E in the 1980s but are now approaching three-quarters. With their rapid obsolescence, these assets have lives that span from three to eight years. Such trends show that fixed assets aren’t so “fixed” anymore, as asset portfolios have shifted from durable assets toward high-tech information-processing equipment.
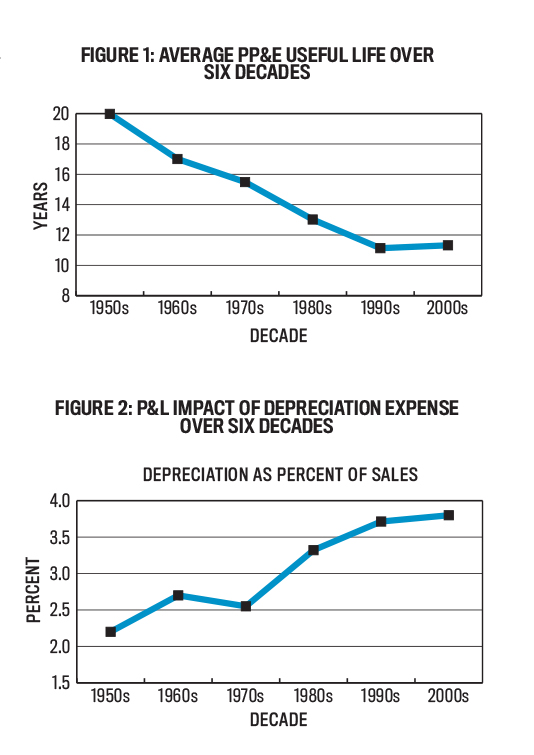
These trends also suggest that the average useful life of companies’ assets has changed. Figure 1 highlights the marked decline since the 1950s. While the average life was 20 years in the brick-and-mortar days of capital-intensive business, it’s declined almost continuously to about 11 years in the tech-savvy new century. Thus, organizations must replace or refurbish their assets more quickly, which has financial consequences.
Coupled with the cash flow ramifications are the noncash earnings implications that accompany a declining useful life. While assets were previously depreciated at an average annual rate of only 5%, depreciation hits the P&L more rapidly these days as this rate has now almost doubled. Moreover, Figure 2 shows that depreciation is a much larger component of the P&L, as the depreciation-to-sales ratio has also nearly doubled from about 2% to almost 4%. Thus, assets represent a much bigger burden on earnings today, even before considering the cash expenses that also affect the bottom line.
This changing dynamic is consequential to financial performance. Yet these assets may be overlooked once placed into service, sitting in a subledger with little intervention. Hence, the importance of how CFOs manage those assets’ productivity to grow the top line and how they control the expenses from using those assets to safeguard the bottom line can’t be overstated.
MOVING YOUR LINE OF SIGHT
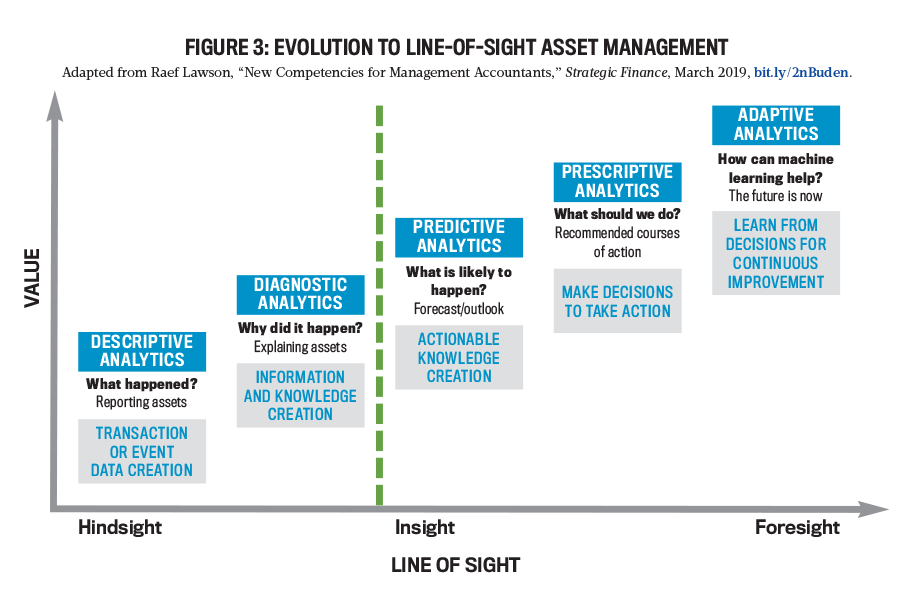
Figure 3 applies the information-value-chain decision-making framework from the book Cost Management: A Strategic Emphasis by Edward Blocher, David Stout, Paul Juras, and Steven Smith to discuss the value proposition of moving your line of sight by integrating data analytics into your asset management efforts.
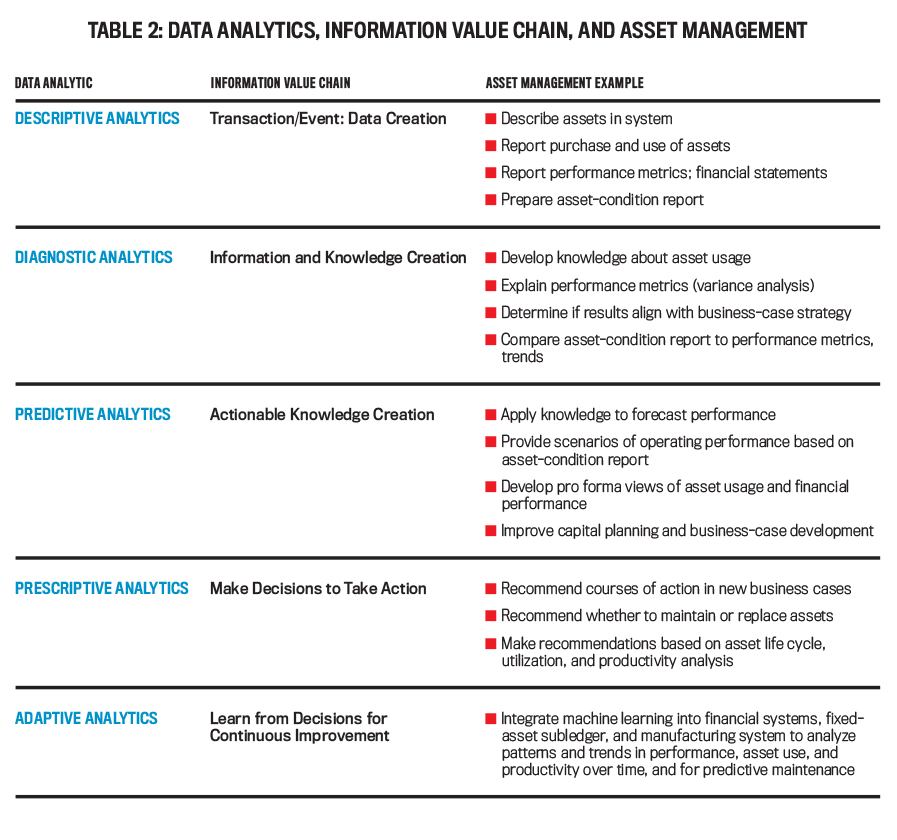
Asset management examples are summarized in Table 2. This applied framework can help the CFO organization move from reactive asset analysts to proactive asset-management catalysts in the business.
Descriptive Analytics. Accounting professionals are adept at explaining what happened. Management accountants in leadership positions support business partners by reporting their operating performance and their financial position every period.
CFOs also perform this reporting role for tangible assets. They direct their purchase, place the assets into “service,” and describe them in the subledger. They ensure assets meet the capitalization criteria and assign an asset class and useful life for financial reporting. Next, they describe the investments and depreciation expense in the financials to assist in translating “operational needs” into “financial effect.” Then they analyze the performance of these assets using ratios and metrics and share this with profit-center managers to measure their effectiveness.
To report the state of their assets, CFOs could also examine the subledger and create a report by asset class and age of assets. This could be a first step in identifying the condition of assets to assess their productivity. They could match this with a physical inspection of assets and produce a report of assets by age and condition (“asset-condition report”). This could allow those in the CFO organization to proactively use analysis to describe asset usage, a good first step in moving their line of sight for asset management.
Nonetheless, while they lead financial reporting and analysis, everything they do at this stage is reactive. They explain transactions and produce data to make sense of what happened as a result of those transactions.
Diagnostic Analytics. The job doesn’t end with only descriptive analysis. Finance professionals hope to add value to partners’ business in other ways, so they dig into why the use of assets created the performance just reported (e.g., variance analysis). This allows knowledge creation for business partners about their asset usage with the goal of continuous improvement. For instance, overhead costs for a manufacturing facility may be running above expectations, but this information prompts new knowledge from an engineering study that explains how to improve utility usage. Or maybe sales generated from new manufacturing equipment are below expectations because of order backlogs caused by manufacturing process inefficiencies, and this information prompts new knowledge about how to reconfigure manufacturing equipment alignments to improve efficiency and throughput.
And they can compare the asset-condition report to performance metrics and trends. Perhaps there are correlations between age/condition and performance. Maybe new assets are less productive as they “break in” or older assets are less productive because they require attention. This can be a step toward understanding why performance may be exceeding or lagging expectations.
While new information and knowledge are created from digging into explanations of “why” to help promote change, leaders in management accounting are still primarily reactive analysts as they make sense of what happened. Can finance professionals do more as business partners to be co-decision makers, assisting in the formulation and implementation of the organization’s strategy? Can they not only explain the use and performance of assets but also become asset managers along with their partners? The goal is to move their line of sight further into insight and foresight to add value by predicting, prescribing, and adapting through analytics.
Predictive Analytics. Once they explain the “what” and “why” for their assets, management accountants are ready to develop richer insight by helping to anticipate the future. This means using information gained about historical asset performance to create pro forma performance views that become actionable knowledge for their business partners.
Using the previous example of identifying needed manufacturing equipment reconfigurations to accelerate production, the resulting P&L outlook quantifying the effect on sales and costs will provide actionable knowledge for the manufacturing team about how to improve asset performance. Finance professionals could also provide scenarios of operating performance based on an asset-condition report to anticipate where repairs or new capital expenditures are needed. Armed with this knowledge, they can formulate pro forma outlooks of the capital, expense, and revenue (or cost savings) effects of the asset-reconditioning efforts. This actionable knowledge can feed into future P&L outlooks, capital budgets, and new business cases.
And they don’t have to be reactive and wait until month-end when they report the financials to find out how they performed. They can be proactive, thanks to real-time data extraction capabilities from enterprise resource planning (ERP) systems, by determining performance throughout the month. For instance, they can create weekly customized pro forma reports that pull in real-time revenues and expenses from the system for the profit center that can be shared with business partners in advance of book close. This can help predict financial performance by informing about whether assets are meeting expectations or whether there are other performance issues that can be addressed now before it’s too late.
Prescriptive Analytics. As proactive decision makers, finance professionals go beyond predicting performance by also recommending courses of action based on the financial consequences of each operational decision. They bring descriptive, diagnostic, and predictive analysis together to make decisions and take action.
Let’s consider how such analysis can be used in asset management to drive better performance. As they employ the asset-condition report and knowledge about asset utilization/productivity to predict performance scenarios, they can prescribe a strategic path with new business cases that articulate the organizational need for asset investment and map out the predicted outcomes. For instance, if the analysis from the three earlier phases of data analytics shows an aging life cycle for assets has slowed operational productivity, they can recommend new capital investment that is matched with predicted performance outcomes such as increased revenues, reduced costs, faster production throughput, improved product quality, faster or improved cash flows, etc. In addition, based on the condition of the assets, they can make recommendations about whether to maintain existing assets (with maintenance cost) or to replace assets (with new investment cost).
Of course, the future state of analytics may mechanize even more of the mundane work. Imagine the benefits reaped by building intelligence into systems to associate asset attributes (e.g., age, condition, recent repairs, utilization rates, etc.) with performance so that the systems provide the predictions and recommendations. That is, systems take data about assets and create information, actionable knowledge, and recommendations, allowing managers to review this information and to intervene by implementing the best courses of action. Thus, management accountants can become more effective, using their expertise to partner more in decision making and to assist in the formulation and implementation of the organization’s strategy.
Adaptive Analytics. Machine learning can improve predictive and prescriptive analytics to support asset-investment decision making through adaptive analytics. The use of machine learning can allow data to provide predictive asset management and monitoring with the goal of continuous improvement. Such intelligent systems become knowledgeable themselves by processing data over time and learning the patterns from this data to make predictions. The benefit of this learning is that it can be programmed so that it’s performed without direct human involvement, allowing managers to focus on decision making and implementation. Human intervention will still be required in asset management, but how we intervene will afford CFOs and their teams more time on activities that require foresight judgment based on professional experience and tacit knowledge of the business.
For example, the systems can repeatedly examine equipment utilization by monitoring manufacturing cycle times and scrap rates over time to learn performance patterns and then predict maintenance/replacement requirements and intervals. By flagging high-risk assets for manager review, machine learning plays a crucial role in supporting investment prioritization. This knowledge results in possible new costs, improved revenues, future cost reductions, and new capital investment. Therefore, machine learning can help CFOs gain a better pro forma view of the business by enabling them to map these predictions into future P&L outlooks and business cases and to yield insights about asset usage that help to better optimize operational and financial performance. And machine learning can help support investment optimization by answering questions such as which assets to replace, when to replace them, how to replace them (e.g., repair, refurbishment, or replace), and how much to spend.
EVIDENCE FROM CFOS
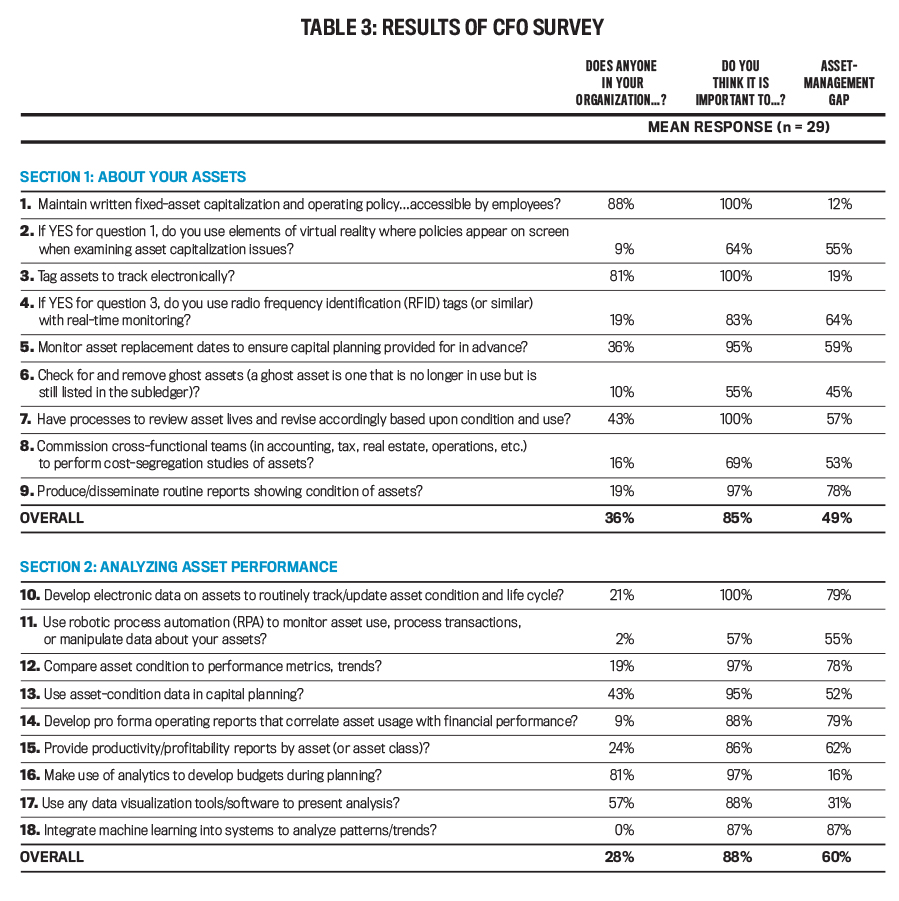
We solicited information from CFOs to learn how they’ve integrated data analytics into asset management and how much further they believe their organizations must go with this integration (see Table 3).
Responses were solicited from CFOs using a partial member list provided to us by a CFO member organization and from professional contacts. We obtained survey responses from 29 CFOs who have an average of 29 years of total work experience. The mean sales of these companies is $272 million, and their mean total net fixed assets is $89.3 million. The CFOs represent a wide array of industries, including pharmaceutical, manufacturing, telecommunications/electronics, and wholesale trade, among others.
We first asked questions about how their companies use data analytics in asset management and then about how they use data analytics to analyze their asset performance. For both sets of questions, they provided responses about what their companies are actually doing and what they should be doing. Overall, there are fairly sizable gaps between what is and should be performed, suggesting more work is needed. For instance, there’s a 60% gap in the use of data analytics to analyze assets. Fewer than one-third of CFOs are performing the data analytics that we addressed in the survey, but about 90% of CFOs believe their companies should be doing so.
Our findings show that what’s currently being done is focused more on information management than on analysis to drive decision making as companies are using data analytics for descriptive and diagnostic analysis rather than for predictive, prescriptive, or adaptive analytics. For instance, most companies have a fixed-asset policy (88%), tag assets to track electronically (81%), use some form of analytics during planning and budgeting (81%), and use data visualization tools to present analysis (57%).
In contrast, fewer companies consider asset condition to predict operating performance or prescribe courses of action (responses to questions 5, 7, 9, 12, 13, and 14 average only 28%). In fact, only 9% of companies develop pro forma operating reports that correlate asset usage with financial performance (question 14).
Finally, almost no companies incorporate adaptive analytics into their asset management through such technologies as virtual reality, real-time monitoring, robotic process automation, or machine learning (responses to questions 2, 4, 11, and 18 average only 7.5%). Thus, only 20% have shifted their line of sight from hindsight to insight, although 86% believe they should be doing so. These findings suggest there’s still room to grow as companies have been slow to invest in developing their data analytics capacity for asset management.
We spoke to several finance professionals to gain insights about these findings. They were very candid, and the discussions yielded five common reasons:
- Infrastructure. CFOs mentioned that they don’t have the software and system infrastructure in place to do more advanced data analytics, so they rely on the platforms they already have (such as spreadsheet analysis), which creates limitations. One CFO added that in the manufacturing facility, they do analyze asset condition more closely, but it’s only on a case-by-case basis (and thus reactive) with no formal process to integrate the analysis into financial reporting to correlate asset performance with financial performance.
- Cost. There was clear agreement that more advanced data analytics would require significant investment, and one CFO commented that he would be unlikely to make such investment until others do.
- Deployment/training. CFOs also mentioned that they don’t have properly trained staff who could perform data analytics. One CFO added that reports are currently provided by the IT team, which doesn’t have the financial background. Thus, the investment would include adding head count, which contradicts the tight control over selling, general, and administrative costs and expense-to-revenue ratios.
- Time constraints. CFOs talked about not having enough time because they already do many other routine analyses that are needed by their business partners. Much of this analysis is descriptive or diagnostic, and the predictions and recommendations become judgment calls based on interpreting financial reports using managers’ tacit knowledge of their business.
- Mind-set. It was clear from our discussions that assets are being overlooked as the CFOs talked about the heavy emphasis on the P&L. They acknowledged that the economic impact of assets is large, but they’re taken for granted. So there’s no traction for developing intelligence about their use and condition through data analytics.
WHAT’S NEXT?
As we’ve emphasized, data analytics offers management accountants the opportunity to use enabling technologies in asset management to move their line of sight toward decision making. Yet despite the magnitude of fixed-asset investments, few CFOs feel their companies have moved their sight very far. These CFOs will be crucial in setting the tone at the top for transitioning to a new digital-CFO organization that will have no choice but to upskill as machines do the mundane work of the future.
Our discussions with CFOs reveal five possible obstacles that could become focal points in this transition. And the framework we provide can help organizations embrace new investment in data analytics to move from analyst to catalyst in the business to align the company’s assets with its strategic direction for more effective decision making.

December 2019


