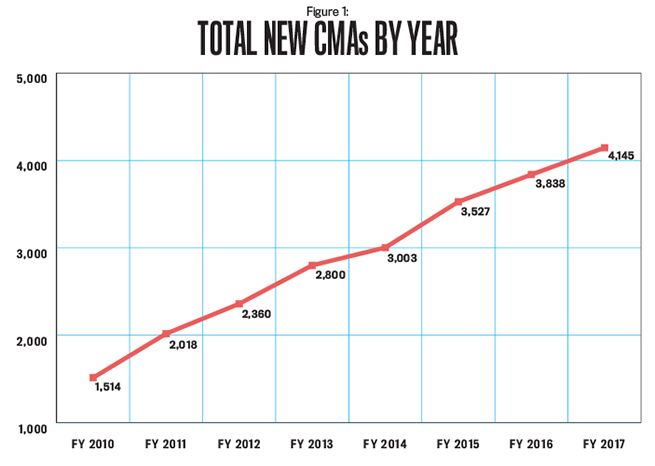
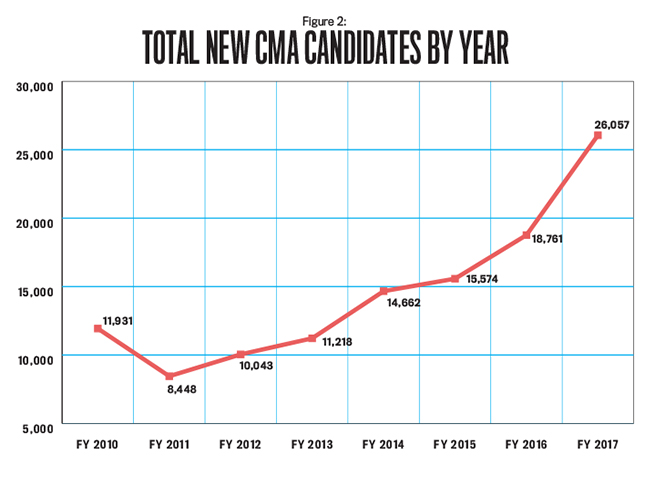
That CMAs have a superior earnings advantage is well established. For years, IMA’s salary surveys have found that CMAs earn more in annual salary and total annual compensation than their noncertified counterparts. And that difference is increasing. In 2010, the gross difference in salary between a CMA and a noncertified individual was approximately $15,000 across all age brackets. In 2016, that difference had grown to approximately $25,000 across all age brackets. And, as you can see in Figures 1 and 2, the numbers of new CMAs and CMA candidates also have seen substantial growth.
In November 2011, we first presented research that empirically quantified the impact the CMA has on an individual’s career earnings. (We updated those results in November 2014.) This expression of what we call the CMA advantage was another way to illustrate the value of earning the CMA. While the number of accounting and finance professionals earning the CMA continues to grow—and with IMA’s salary surveys showing a greater difference in the salaries of CMAs and noncertified members—we’re here to provide another update on the CMA advantage using the three additional years of data (2014-2016) now available.
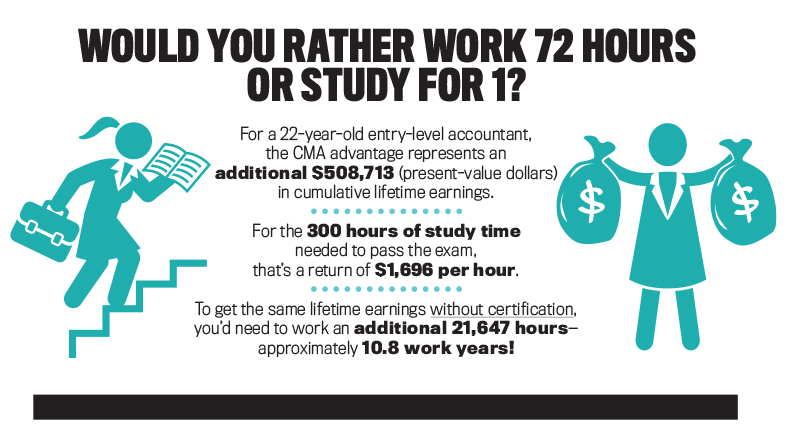
Our analysis shows that a 22-year-old entry-level accountant in the United States adds approximately $509,000 net present value (NPV) to his or her cumulative lifetime earnings by investing the 300 hours needed to study for and pass the CMA exam. In other words, for each of those 300 study hours invested, the return is $1,696 NPV. Still think that 300 hours of studying is too much? If you’re 22, it will take approximately 20,000 hours of working at your noncertified wages to match the NPV that those 300 study hours can earn for you. For each hour you choose not to study for the CMA credential, you’re actually choosing to work more than 72 hours at noncertified wages. How is working 72 hours rather than studying for one hour improving the quality of your life?
OUR MODEL
Table 1 presents the NPV of the CMA for ages 22-59. This represents the cumulative amount of additional income you can earn by attaining the CMA at a specific age. To quantify the lifetime values of earning the CMA, the model includes salary information for CMAs and noncertified individuals by age and also incorporates the initial costs of earning the credential as well as the yearly maintenance costs needed to keep it active. As such, the model provides relevant, comprehensive, and generalizable CMA credential NPV. We use a long-run historical rolling-average inflation rate calculated over a 67-year period (1924-1990) to yield more theoretically sound and accurate salary projections for both CMAs and noncertified accountants. We then applied those long-run average rates to the previous 26 years of CMA and noncertified salaries to project salaries over the next 44 years (2016-2059).
Establishing Starting Salary Figures
The first step in building the model was to establish starting salary figures. We had to gather salary information for CMA-certified and noncertified management accountants over their entire careers, from the typical 22-year-old entry-level professional to a 65-year-old at retirement. For the entry-level salary data, we used Robert Half’s 2015 Salary Guide for Accounting & Finance, which provides actual starting salaries for entry-level accountants without certification across all company sizes (small, medium, and large). The 2015 average starting salary across all firm sizes was more than $47,208, which became our starting point. Robert Half’s 2015 Salary Guide suggests certification carries a (conservative) 10% premium, so we used this figure for estimating the salary of a CMA-certified entry-level accountant as $51,929 for a 22-year-old professional ($47,208 5 1.1). For the analyses for ages 23-65, we used the salary data from IMA’s 1990-2016 salary surveys.
Projecting Future Salary Amounts
After calculating the average 2015 salary data for accountants ages 22 to 65, the next challenge was converting these 2015 cross-sectional salary survey numbers into reasonable longitudinal salary projections into the future (2016-2059). We increased projected salary amounts using the long-run historical rolling-average inflation rate as reported in the Consumer Price Index (CPI) for the period. For example, if the long-run average inflation rate was 3.1% in a given year, we increased wages using that amount during that year.
To test this method, we used the 1990-2015 years of salary data to project what salaries for the various age brackets should be in 1991 to 2016 and found that our 1990-2015 projection of 2016 noncertified salaries yielded an average positive bias of 19%; thus we corrected our projections by reducing all of them by an average of 19%. Additionally, we found our projection model yielded an average positive bias for 2016 CMA salaries of 17%. Once again, we corrected our projections by reducing them all by an average of 17%. This positive bias in the model was expected given that the long-run moving average that we used as the inflation factor in our model was 3.105 for 1990-2015, yet the actual CPI index was much lower for most of this time period. For 1990-2015, the CPI averaged 2.6, and in 2009 the CPI actually was -0.4. Therefore, in periods where the actual CPI is lower than the long-run moving average CPI, our model will overestimate projected salaries. In order to be conservative, we reduced all the salary year projections for 2016-2059 by the respective upward bias, thus reducing all our model’s salary projections. It’s reasonable to assume that this historic period of low inflation won’t last and that the CPI will return to long-run moving average. By making these downward adjustments, our model reduces all salary projections for the entire 2016-2059 time period even though the CPI will probably return to the long-run averages.
We tested the model for internal validity by using it 3,264 times to produce salary projections and compare them with the actual known salaries from the salary survey data across all age brackets for 1991-2016. The salaries for noncertified individuals (1,509 model projections) were 86% accurate (defined as the estimated salary divided by the actual salary). For CMA salaries, the accuracy was at 87% (1,755 model projections). As we moved toward using all 26 years of data, the accuracy is mid-90% for noncertified salaries and 96% for CMA salaries. We use all 26 years of data to project salaries for 2016-2059.
Converting to Present Value
Since the testing indicated that the accuracy and reliability of our salary projections are reasonable, the next step in our analysis is to provide the most relevant salary numbers for the CMA advantage. The challenge is that all these noncertified and CMA salary projections and their differences—the CMA advantage—are in future-dollar terms. Since a decision to attain the CMA credential is made in the present, it’s essential to convert these future-value dollars to present-value dollars through discounting. This will show potential candidates the hundreds of thousands of dollars of cumulative lifetime present-value career earnings they could gain from earning the CMA at their specific age.
We converted the salary projections to present-value dollars using a 5% discount rate. This 5% rate was significantly higher than the 30-year U.S. Treasury bond rate CMT (constant maturity) of 2.96% on April 29, 2017, thus producing more conservative present-value salary projections. Discounting at 5% yielded the estimated CMA certification present value to be $544,721 for a 22-year-old. (See the first cell in the second column of Table 1). Thus the 300 study hours for a 22-year-old passing the CMA exam in 2017 have earned the individual, on average, more than half-a-million present-value dollars.
The Costs of Certification
After calculating the present value of the future earnings for CMAs, we turned our analysis to six costs associated with attaining and maintaining the CMA credential:
- Current fees for the CMA examination
- Two days’ lost wages and travel costs
- CMA review program cost
- Cost of 300 hours of examination preparation
- IMA membership cost
- Lost wages for 30 hours of annual continuing professional education (CPE)
The first four are the costs associated with attaining the certification. Taken directly from IMA’s website, the current CMA fees (column 3 of Table 1) include the CMA entrance fee and the costs to register for the two exam parts. To calculate the lost wages for two days of taking the exam (column 4), we took the 2015 average salary for a noncertified individual at that age and divided it by 2,000 hours to get the hourly rate. We then multiplied that rate by 16 hours to represent two days (though if the individual is salaried, it could be argued that there is no opportunity cost of lost wages). For the current cost of a CMA review (column 5), we used the cost of the Gleim Traditional CMA Review package listed on the IMA website. The final attainment cost (column 6) reflects the calculation of opportunity cost for studying 300 hours. This is calculated using the age-dependent hourly rate.
The other two costs are for keeping the certification active: the annual cost of IMA membership and the lost wages associated with the 30 hours of annual CPE. The cost of continued IMA membership (column 7) is calculated using the current membership cost of $245 and estimating a 3% annual cost increase for inflation calculated over the time period from the current age through retirement at 65, with these future membership fees discounted back to the present value using the 5% discount rate. The opportunity cost of lost wages for the 30 hours of annual CPE (column 8) is derived from taking the CMA’s hourly rate from age of attainment through retirement at 65—also discounted using a 5% discount rate back to the present day. This assumes their employer won’t let the CMA fulfill the CPE during regular office hours.
There are two schools of thought regarding calculating this opportunity cost. The conservative view assumes the CMA has to do this outside regular work hours. The second school of thought is that the CMA is paid a salary and, as such, works as many hours to get the job done. In other words, there’s no lost work and thus no opportunity cost to fulfill the CPE requirements. While we have chosen the conservative approach, Table 1 easily accommodates those who follow the second school of thought by allowing them to exclude this cost and just add it back to the NPV in column 10.
The Net Present Value of the CMA Advantage
Table 1 shows the present value of the CMA cumulative lifetime earnings (column 2) as well as the present value of all CMA attainment and maintenance cost projections (column 9). By subtracting the present-value costs from the cumulative lifetime earnings, we get the net present value of the CMA (column 10). Figure 3 presents these results graphically.
The calculations showing the NPV of attaining and maintaining the CMA certification are averages. Individual results will vary with the size of the firm and type of industry. Since these effects have been evaluated in IMA’s 2016 Global Salary Survey, they aren’t duplicated here.
Return on Study Time
The final calculation is to take each uniquely determined NPV of the CMA and divide it by the 300 study hours suggested to pass the CMA exam (column 11 of Table 1). This shows the return per study hour. For example, a 22-year-old would earn approximately $1,696 NPV per hour studying for the exam ($508,713/300 hours).
Since the 22-year-old is part of the Millennial generation, which most research and surveys suggest is more interested in quality of life than dollars earned, the added earnings or hourly return on studying might be insufficient for demonstrating the CMA advantage. Another way to interpret the NPV dollar analysis is to apply a quality-of-hours metric that shows the time value of the money earned. We start by calculating the hourly rate of a noncertified entry-level accountant in the corporate market based on Robert Half’s 2015 Salary Guide: $47,000/2,000 hours = $23.50 per hour. By dividing that into the return per study hour ($1,696), we see that every hour spent studying for the CMA exam at age 22 earns them the equivalent of approximately 72 work hours ($1,696/$23.50). In terms of quality of life, that’s almost two weeks of work. So would the noncertified 22-year-old accountant prefer to work 72 hours, or would he or she prefer to spend one hour studying for the CMA exam?
Examining this issue from a present value of cumulative annual earnings perspective for the noncertified 22 year-old, we found that their present value of cumulative annual noncertified earnings for the next 9 years and 42 weeks is equal to the 22-year-old CMA’s advantage of $508,713 NPV. So the noncertified individual’s choice to study 300 hours or work 9 years and 42 weeks both yield a present value in 2016 of $508,713.
A SIGNIFICANT RETURN ON INVESTMENT
All three analyses conducted over the past five years have shown that the CMA advantage is more than half-a-million dollars for a 22-year-old accountant. And earning the CMA at any age leads to greater earnings throughout your career. We feel the consistency of this information is valuable for everyone from entry- to advanced-level accountants and their accounting managers and mentors. In fact, since undergraduate students can also sit for the exam before graduation, accounting and finance professors can use this analysis to persuade their students to begin studying for the CMA exam.
To put it succinctly for noncertified accountants, there is simply no better investment of your time and money than those hours and dollars spent attaining and maintaining the CMA credential. We challenge all noncertified readers of this article to use this information to calculate your own unique NPV CMA advantage and convince yourself it’s time. Visit www.imanet.org/cma-certification/getting-started to enroll in the CMA program and begin the journey toward certification. Good luck on the exam!
Authors’ Notes: We want to acknowledge the more than 25 years of salary surveys conducted for IMA. Without the careful data collection and analysis by the survey authors—which over the years have included David L. Schroeder, Karl E. Reichardt, Ken A. Smith, Lee Schiffel, Coleen Wilder, and Kip Krumwiede—this study could have never been undertaken. We clearly stood on the shoulders of giants. We also would like to especially thank and acknowledge the comments and suggestions of Jeroen Bos and John Brausch.
September 2017


