The technology and analytics domain of the IMA® (Institute of Management Accountants) Management Accounting Competency Framework requires accountants to be adept in information systems, data governance, data visualization, and data analytics. Specifically, the Framework refers to data analytics competency as the ability to “extract, transform, and analyze data to gain insights, improve predictions, and support decision making.” Therefore, helping students gain data analytics competency is extremely important.
Adding data analytics to cost accounting curricula is a good alternative because cost accounting is related to data analytics, given its emphasis on using data to support decision making. And cost accounting textbooks have already started to incorporate data analytics. For example, the textbook chosen for my cost accounting course, the 17th edition of Horngren’s Cost Accounting, written by Srikant M. Datar and Madhav V. Rajan and published in 2020, includes a chapter emphasizing data analytics that didn’t exist in the previous version.
In this study, I describe in detail how I added data analytics to my cost accounting curriculum by adopting the data analytics content in Horngren’s and adding more content that complements it. I also show how my students benefited from this. My practice concurs with the call in the article Teaching Toward Tomorrow that promotes adding CMA® (Certified Management Accountant) exam content to accounting curricula. According to the article How the CMA Exam Is Made, data analytics is included in the CMA exam. Ultimately, instructors who are considering adding data analytics to their accounting course curricula may benefit from this research.
ADDING DATA ANALYTICS CONCEPTS
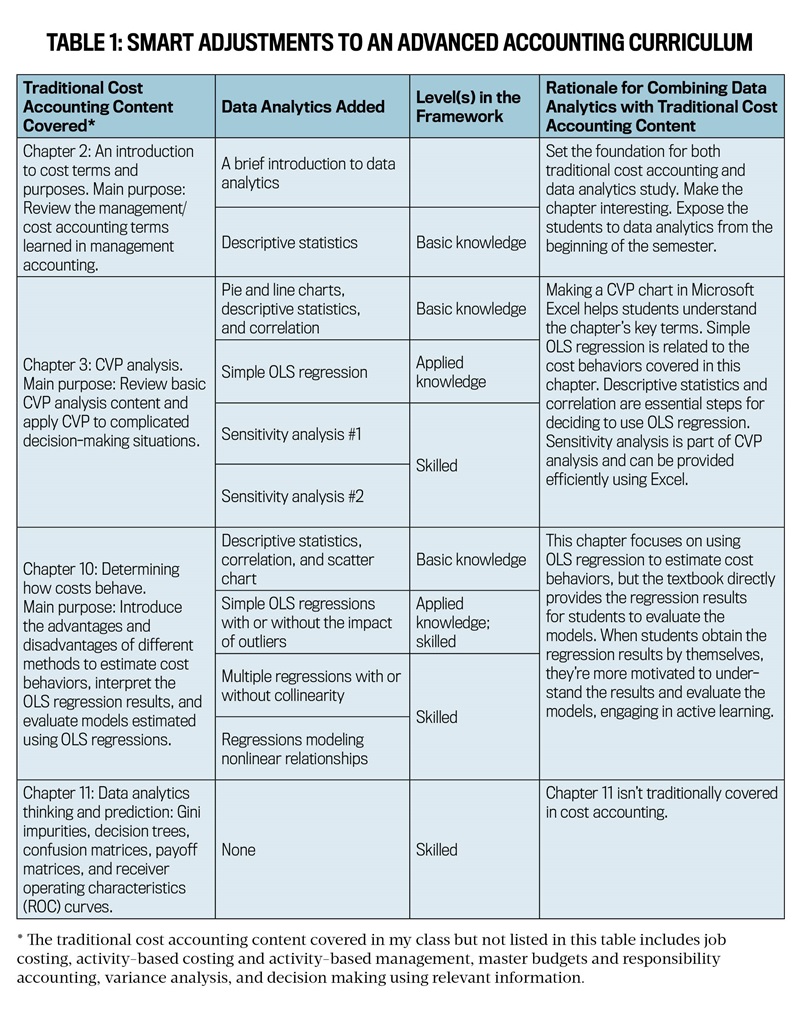
The specific data analytics added to my cost accounting curriculum are listed in Table 1. The second column presents the data analytics added to my course, and the third column shows the levels of data analytics in the course, classified according to the Framework. The fourth column explains the rationale behind integrating data analytics and specific traditional cost accounting content.
Chapter 2 in Horngren’s, covered early in the semester, introduces basic concepts to be used in the course, setting the foundation. Yet most introductory management accounting courses would also cover most, if not all, of these concepts. The chapter itself doesn’t include data analytics, so adding it to the discussion turns a potentially dull review into the beginning of an exciting data analytics journey. And while the chapter serves as a base for cost accounting concepts, adding data analytics also sets the foundation for learning data analytics in the course. Starting data analytics early in the semester also helps spread the study load while providing the opportunity to turn short-term memory into long-term memory.
To briefly introduce data analytics, I first discuss the domains in the Framework, pointing out that data analytics is among IMA’s designated competencies. Then I introduce the five steps in the data analytics process: know the question to be answered, obtain the relevant data to answer the question, clean the data, analyze the data, and report the results. I emphasize that, in this course, we focus on data analysis.
I then describe data analytics as the process of building a house using tools and concepts. The house is the final result of data analytics, and the tools include Microsoft Excel, Tableau, and other software packages. The concepts are drawn from knowledge of cost accounting and statistics. I emphasize that the only tool used for data analytics in my course is Excel because it’s sufficient for my purposes: helping students learn basic knowledge of data analysis and motivating them to study it in the future. Once students have a passion for data analysis, they can quickly learn more complicated data analysis concepts. According to Raef Lawson and Daniel Smith, analytics and visualization programming can be learned in 16 to 20 hours.
After introducing my students to data analytics in a single class session, I show them how to obtain descriptive statistics of a data set containing total costs and variable costs using the Data Analysis option in Excel. Additionally, using a data set with outliers, I call my students’ attention to the difference between the mean and median to show that outliers can severely affect the mean.
Although obtaining descriptive statistics using Excel is simple, this is the first time in my course that they see the analysis tools in Excel. They can find not only the Descriptive Statistics tool but also the Correlation and Regression tools after clicking on the Data tab and then the Data Analysis option, thus preparing them for future data analysis in my course. Additionally, using the data set with cost variables provides the students with new experience connecting data analytics with cost accounting.
NEXT UP: CREATING A CVP ANALYSIS
Chapter 3 in Horngren’s discusses cost-volume-profit (CVP) analysis, to which I add data analytics that complement this. First, I show students how to make a cost-volume graph, which is a line chart, using Excel and provide a link to a YouTube video for their future reference. After we make the cost-volume chart in Excel, I ask them to label it and find the breakeven point. While we’re on the topic of visualization, I also show them how to use Excel to create a pie chart that illustrates the components of manufacturing overhead.
In Chapter 3, I also show students how to estimate a simple regression using Excel to determine unit variable and fixed costs, which are frequently used in CVP analysis. So, adding simple regression to estimate unit variable costs and fixed costs is still relevant. Moreover, adding simple regression in Chapter 3 helps spread the study load and keeps data analytics on the students’ radar for a longer time. Here, I emphasize only the interpretations of the estimated intercept and slope and discuss t-statistics for statistical significance, leaving more complicated discussions for Chapter 10.
Before estimating simple regression, I first help the students to obtain the descriptive statistics to see whether there are outliers that make ordinary least squares (OLS) regression inappropriate. Then, for data points belonging to a normal distribution, we obtain the correlation between the dependent variable and the independent variable.
Because sensitivity analysis is part of cost-volume analysis in this chapter, I use Excel to add two complementary sensitivity analysis methods. Adapted from a YouTube video, the first sensitivity analysis is used to predict operating income for different combinations of sales volume and price, with an emphasis on the importance of classifying the costs into fixed costs and variable costs.
The second sensitivity analysis uses a case study published in 2011, Goats: The Green Alternative (A), from Harvard Business Publishing, which allows instructors who sign up on the company’s website to review the case and the solution for free, although adoption of the materials requires a small fee for each copy. This case describes a real-life situation to which CVP analysis with a sustainability emphasis can be applied. Students need to extract cost information from the case description and then use the functions in Excel to calculate the operating income given an offer from a potential customer. The resulting model is used to predict operating income if any variable used to calculate the operating income is changed.
THE INS AND OUTS OF COSTS
Determining cost behaviors is the focus of Chapter 10, which introduces the regression analysis method, including simple regression and multiple regression, used to determine variable costs per unit and fixed costs that are used to predict total costs. This chapter also provides specific criteria to evaluate cost functions and discuss collinearity problems, and it also comes with exercises complete with data, regression results, and requirements for interpretations of regression results. Therefore, I use Chapter 10 in my cost accounting curriculum to help students gain data analytics competency.
The content in this chapter is complemented by additional content. What does this mean? First, before calculating regression estimations, students obtain descriptive statistics and correlations of variables using Excel and the data for regression exercises, because the descriptive statistics and correlations are necessary to determine whether OLS regressions are appropriate. Second, for the exercises chosen from Chapter 10, students replicate the textbook’s regression results using Excel. Third, using Excel and the specific data sets I create, I show students the impact of outliers on the OLS regression results and the effect of collinearity on the estimated coefficients in multiple regressions. Finally, I create data points to show nonlinear relationships estimated using Excel.
PREDICTING BEHAVIOR AND OUTCOMES
The concepts of Gini impurities, decision trees, confusion matrices, payoff matrices, and receiver operating characteristics curves are introduced in Chapter 11, the main purpose of which is to predict customers’ behavior. The content in this chapter is data analytics-intensive, so I place it in my cost accounting course.
The data analytics added to my cost accounting curriculum belong to three levels of data analytics, which are presented on page 33 of the Framework, as follows:
First, according to the Framework, obtaining descriptive statistics is a basic data analytics skill. The two sensitivity analyses are related to creating spreadsheets and using basic functions in Excel, so they’re also part of the basic knowledge. Note that charts, such as pie charts and line charts, are part of the basic knowledge of data visualization, as shown on page 34 of the Framework. To simplify the learning process, I include them as basic knowledge related to data analytics in my cost accounting course.
Second, because a type of applied knowledge in the Framework is the ability to “Use simple linear regression to predict business outcomes and interpret results,” I classify simple regressions as applied knowledge. Correlation is not mentioned in the Framework; I classify it as applied knowledge because it’s obtained using the Correlation analysis tool in Excel, just as the simple regression is estimated using another Excel analysis tool, Regression, which the Framework classifies as applied knowledge.
Third, the Framework defines one kind of skilled data analytics technique as using “predictive analytics techniques to interpret results, draw insights, and make recommendations.” The two sensitivity analyses predict operating income, and Chapter 11 focuses on techniques used to predict customer behaviors, so they’re at the skilled level according to the Framework. Another kind of skilled data analytics technique in the Framework, “Use multiple regression for predictive and prescriptive purposes, and interpret results,” corresponds to the multiple regression practice in Chapter 10. In addition, because I was unable to find a classification in the Framework, I classify the simple regressions used to emphasize the impact of outliers, as well as the regressions used to show nonlinear relationships, as the skilled-level knowledge, because they’re related to evaluating specific issues affecting regressions beyond a simple regression discussion.
DELIVERY AND EVALUATION METHODS
I organize the data analytics content in Excel spreadsheets. For each practice, the question area and the answer area are in the same spreadsheet. Whenever possible, I also include useful knowledge and online links for the practice exercise. Additionally, when I design the answer area, I highlight the title in green and highlight in yellow the cells or areas that the students need to finish, making it easy for them to find their task and for me to grade their work. I post the Excel workbooks in the weekly modules on Canvas so that my students can find and download them easily.
During the class sessions for data analysis, I first explain the basic content needed and then illustrate the method using Excel. I also create practice questions for the students to finish during class, with help from me and their peers, if necessary.
How do I compensate for the limited class time I have to cover data analytics and the traditional cost accounting content? For one, for comprehensive activity-based costing practices, there are calculations for multiple direct and indirect costs for multiple products. I provide answers to some of these costs, leaving the rest for in-class practice. The in-class time saved can be used for data analytics. Also, in the Excel workbooks, the last one or two spreadsheets contain questions with answers provided to allow students to practice on their own after class, making up for the limited class time.
Class participation is the key to the primary evaluation of data analytics using Excel. As such, I use Canvas to record class participation. I create quizzes in Canvas that are in the form of graded surveys. After students finish one Excel practice exercise, I open a quiz to allow them to upload their work as the answer to the quiz. After students submit their finished Excel practice exercise, they earn total points per the graded surveys’ design, understanding that I or another instructor will review their submitted work for completeness and accuracy and adjust points accordingly. The graded surveys enable instructors to monitor the quality of students’ in-class Excel practice while reducing the grading load. Because the answers are given during class time, there’s no need to provide feedback on the graded surveys, so there are minimal drawbacks to using them. In addition to class participation, I include some key knowledge points related to data analytics in my students’ midterm and final exams.
BENEFITS FOR STUDENTS
My goal in enhancing the cost accounting curriculum is to help students learn basic data analytics and motivate them to pursue data analytics in the future. Their in-class performance shows whether they’ve grasped the basic data analytics concepts covered in the course. After multiple applications of the data analysis tools in Excel, such as those for descriptive statistics, correlation, and regression, students can quickly find the tools and use them. This helps them gain confidence in their ability to learn data analytics.
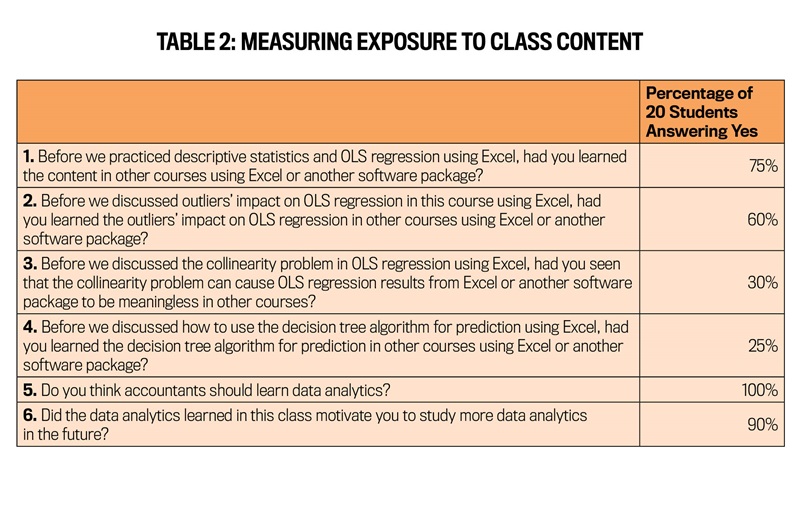
To investigate the motivation effect, I conducted a survey for the cost accounting class. All 20 students in the class provided feedback. Table 2 presents the first six survey questions and the percentage of students answering yes to each of the questions. Namely, some students already had some exposure to the content covered in the class, but not all of them. Also, they all agreed that accountants should learn data analytics, and 90% of the students think that data analytics added to the cost accounting course would motivate them to study more data analytics in the future. I also report representative answers to question 7, which is about students’ data analytics learning experience in my class and their plans for furthering their data analytics learning (see “What the Students Had to Say”). In general, students confirmed their interest in data analytics and said they intended to learn more about it.
I was successful in adding data analytics to my cost accounting curriculum, with the result being that students clearly benefited. If you’re an instructor who is considering including data analytics in your accounting curricula, this article provides some important advice and resources. Still hesitant? I was too. But my students’ positive attitude toward data analytics made me realize how very crucial it was to add it to their accounting curriculum.
What the Students Had to Say
In question 7, the students were asked to discuss their experience of learning data analytics in a cost accounting course and possibly their plans to learn more data analytics in the future. Here’s how they responded:
“The data analytics in the class was SO helpful! I have had classes with this content before, but I learned and understood more from your class than all the other classes that I’ve had before. The time that we spent on data analytics was so valuable, and I feel like I have a much stronger foundation now to learn more. I most definitely will continue learning about data analytics through continuing education and hopefully through my career path. Thank you for including this in the class!”
“I took a data analytics course before this class, so I felt the material was easy to learn. I could see students struggling to learn the material if they haven’t taken a data analytics course.”
“I think I will use data analytics frequently in my future life. It is very interesting, important, and convenient.”
“I enjoyed learning another layer of data analytics in this course, and it was a very nice break from sometimes just learning budgets and costing. I appreciated the variety.”
“I found that data analytics was interesting to learn about, and I do wish to learn more about other methods too. It’s a somewhat difficult concept for me to understand right away, but I think overcoming that difficulty with more practice using these tools would still be beneficial.”
“I have realized the importance of learning data analytics and hope to take classes in the future to further my education. I have come to realize that no matter what you have in a career, the importance of continuing your education plays a drastic role.”
“The data analytics component to the class was so great. Everything we learned was interesting and relevant. What we have covered in class has inspired me to research more about data analytics on my own, and I’m actually considering pivoting from accounting to data analytics for my master’s program.”
“The last time I was exposed to OLS regression was in a statistics course and in a data analytics class. If you don’t frequently practice building or testing predictive models, you lose those skills or your confidence in those skills. I plan to continue my education with data analytics after graduation by finding courses that can help me build on or strengthen what I know.”
“I never have thought about data analytics as a subject at all, but ever since you introduced it in class, I have been thinking about it and its applications to my career.”
“Data analytics was seamlessly integrated into the Excel practice in this course. I feel that there is merit to data analytics as a tool for accountants, so I will most definitely follow through with my data analytics learning.”
“Data analytics is complex for me. I am still working on understanding the concept. However, I personally think that accountants need to learn it.”

August 2023


