Timely delivery of data depends on the quality of the processes that drive it. As the call for delivering more meaningful data faster, more frequently, and with flexible and insightful variance analytics increases, there’s a corresponding surge in the demand for more consistency in the way the data is organized and flows. Ultimately, it’s process quality that drives the quality of the decisions made by those who use that data.
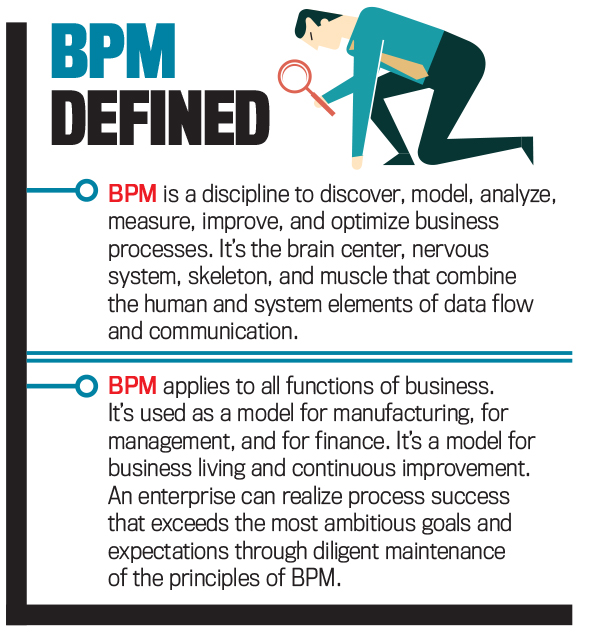
There are endless options for comprehensive software solutions intended to help accounting and finance analysts and controllers manage the flow of financial data from source to report and streamline that reporting through “touchless” financial dashboards. These solutions are only as good as the integrity of the data structures that support them. Further, a network of supporting processes is integral to these structures that deliver the data. The creation, adoption, and maintenance of those process networks and their underlying structures make up the business discipline called business process management (BPM; see “BPM Defined”).
In relation to the business finance, accounting, and reporting goals of an enterprise, the adoption and adherence to the concepts and principles of BPM can ultimately result in greater satisfaction and sense of purpose and fulfillment with both work and life. It also can lead to the support of robotic process automation (RPA) that often creates efficiencies for small and medium enterprises.
IT SHOULD BE SIMPLE
There’s broad agreement on the need to reduce reliance on disconnected Excel files to communicate data. In most going concerns, this is a time-consuming and heavy lift, encumbered at scale by the volume of people, business groups, geographies, and data types involved in the consolidation of reporting segments.
Software vendors offer solution packages that make bold promises using flashy marketing showing sharply dressed financial analysts manipulating touchscreens that display instant business metrics and analytics. These tend to be far less magical than the marketing suggests. Conversion to an enterprise solution is labor-intensive—it’s a labor of planning, organizing, and standardizing, and of convincing human beings to change.
For a single-source system to function and report timely and accurately, data structures between individual autonomous product lines and business segments must agree. This often requires the people in control of these segments to conform their thinking and find commonality toward the shared enterprise goals. Real-time financial reporting—flexible, manipulable, and drillable to any level—is entirely contingent on the commonality of the financial hierarchies that support it.
Common standards in the way that people apply data structures depend on agreement among people. People often have preexisting notions of how to define and view their business structures. When a voice from the top suggests that producing an answer to a complicated question “should be simple,” that request is equivalent to asking someone to change the way they’ve always done things.
A STORY IN PRACTICE
Several years ago, our organization decided that it needed to transform its financial culture to produce a financial workforce that conformed to a world-class set of standardized processes and systems. The top brass selected a leadership team. That leadership team selected a software solution that bolted onto the enterprise reporting system. The software solution would be tasked to integrate all financial forecast data from different locations, business segments, and products into a “single source of truth.”
It was an ambitious goal and a long and arduous journey. In the first level of growth and development, there was an agreement on standards within multiple data hierarchies. The setting of these standards required fundamental changes in the methods that certain business groups used to apply those hierarchies. Some very basic examples of these data structures are as follows:
- Product-specific data
- Engineering projects
- Cost centers and business units
- Employee data
These hierarchies all needed to communicate with each other in a way that allowed, for example, data at the lowest level of inventory to track all the way to producing meaningful results on the enterprise’s balance sheet, income statement (P&L), and cash flow levels for forecast and actuals.
In the process of attempting to implement a single-source solution, the team encountered organically grown, somewhat autonomous functions. The consolidation required human knowledge of unique legacy applications of the system to make the data communicate with itself in a meaningful way. Any possible reform required governance at the top to conform these historically disparate uses of the same tools and hierarchies.
Establishment of a working governance model was an evolution in leadership, and the solution required teams of specialists to address the detailed logical principles for the business data structures to hash out and link up the functional, locational, and strategic differences that existed. More importantly, the effort required agreements among the many character profiles of business leadership at these functional and geographic nodes.
THE SEED PROJECT
As the teams set out to build standards, we collected an inventory of common problems plaguing finance groups across the business segments. The feedback was hard to ignore. Across all business groups, journal entries reassigning operating expenses from one group to another, generally without changing any of the general ledger characteristics of the expense, were a pervasive and widely reported problem in finance consolidation.
The purpose of these “billbacks” was, ostensibly, to provide accurate cost accountability. In reality, the billback environment amounted to budgetary horse trading, with budget managers going to great lengths to move costs off of their own P&Ls. It was a logistical nightmare, rife with inefficiency and conflict among finance and operations groups throughout. There were hundreds of thousands of immaterial transactions, causing strain on the journal entry processing infrastructure, moving relatively low dollars, and generating internal debate between department and division controllers. All of this ultimately had a net-zero impact on the overall consolidated P&L. All parties agreed this was a problem, but there was no ownership of the solution.
As the governance model developed and the teams began to normalize the use of the basic business unit hierarchy structure, the data tree was starting to communicate more effectively. This improved data communication produced an opportunity to build a more standardized mode of allocating costs based on a previously established set of drivers. Those drivers would flow spending forecasts and actuals through a system script that allocated costs to their appropriate cost centers. The end result was an automation of allocations from engineering; selling, general, and administrative expenses; and corporate overhead services. The solution found ownership through the establishment of standards.
This happened through the standardization of the business unit hierarchy as well as governance and ongoing maintenance of those standards. And it was sustainable because of an established set of process workflows that identified and documented the way that each of the suppliers, process executors, and consumers of the data results performed their respective processes.

BPM METHODOLOGY PRINCIPLES
The improvements materialized thanks to a disciplined approach to establish and execute process: BPM. The sponsors of these changes, and the teams they sponsored, applied the following core tenets set forth in BPM methodology:
Business process ownership. The team identified the people who owned the data and decisions at every stage of the transaction cycle.
Knowledge management. The team identified and defined the processes these owners perform and compared the objectives of the individual processes. They scoped the similarities and differences within those stages, documenting suppliers, inputs, process, timing, outputs, and consumers of information at each stage. The team observed how and where systems were engaged.
Defining the start and endpoints of multiple processes allowed for the building of process structure and networking. It illustrated the connectivity of people, data, and systems. In performing this comparison over the multiple locations and stages pursuing common objectives, the team was in a unique position to begin to propose standards in the usage of those systems, data structures, and interface.
Oversight structure. Having performed the comparisons and derived proposed standards, it was critical to obtain the commitment from stakeholders that would adopt them. The allocations team needed the approval and endorsement of the governance structure. Through combined improvement efforts, a structure of governance boards and functional area councils developed that would oversee and monitor process activities. This was the evolution of the delegation and structuring of BPM governance.
One of the most important fundamental decisions taken by these oversight boards was the agreement on a common virtual location to organize, store, and maintain the inventory of process owners and documentation. This critical decision proliferated culture and access for the BPM community.
Metrics and indicators. Once the processes were implemented, owned, documented, and governed, process owners needed to monitor their performance. This required an established set of business metrics and process health metrics that would allow for a periodic scoring of process performance.
There are abundant examples of these types of metrics. Some are specific to the business needs of the process. Some are specific to the timing and completeness of the execution. Others measure the accuracy of the results. Each process is different and requires use of tailored metrics specific to the process and common metrics shared across processes. The important binding component is that the ownership and governance structure must have a forum and a frequency of review and then take action based on the results of process monitoring.
Quality and change management. For ongoing sustainability, the process environment needed a common format for owners to log errors, timing and system problems, or other events that prevented timely and accurate execution. Sustainability depends on the collection of data on the nature and disposition of these quality events.
The same is true for improvement needs. Ideas for change from the ground level of individual process executors up through the chain of process ownership require coordinated effort for decisions on how and when to make improvements. Process owners and oversight bodies must make decisions based on priority, connectivity into other processes, and resources.
WIND IN OUR SAILS
Separate from the allocations project, financial leadership initiated a structural project to create automated P&L forecasts at the individual product-line level. Each reportable segment of the company would consolidate its product line forecasts into autonomous segment P&L statements, each of which would then consolidate into the overall corporate P&L. These collapsing levels of consolidation needed to agree with the mapping of actual accounting data flow and structure that ultimately routes to external U.S. Securities & Exchange Commission reporting. Ultimately, the investing public is the end-state consumer of forecast to actual analyses, so this ability to reconcile data is critical to all levels of management.

Like the allocations project, this was a tremendous, ongoing multiyear effort. It couldn’t continue to succeed without daily adherence to the principles of BPM, following the tenets set forth previously and leveraging the groundwork of the many cleanup efforts that preceded it. This project produced its own set of structural alignments and standardized usage and governance of data hierarchies. While this was a separate effort engaged by teams separate from the allocations work, an interesting cross-pollination occurred.
The same groups of people who resisted change in earlier efforts began to realize the results of the changes that these teams implemented. Product-line revenue, cost, and allocated spending were now successfully flowing from source to report in a more organized fashion, and the owners of that data were able to access the consolidation in comprehensive and drillable reports. Upon realizing this, data consumers began to use the process documentation and quality management records to learn more about processes upstream and downstream of the processes they owned.
Previously reluctant customers of process change began to inquire whether they might incorporate other areas of data flow into the automated allocation system to land on automated P&Ls. In two quarters alone during 2022, six different types of cost of sales and spending activity were automated to land on product line P&Ls using structural allocations mapping that originated through the effort to eliminate billbacks.
The journey to link process and data will never be complete, but the consistent application of BPM principles has produced an environment where analysts at all levels of the business are spending increasingly less time on data tie-out and discrepancy resolution, and increasingly more time on trend analysis and meaningful variance explanation. The automation journey is taking shape and aiding in the transition of data owners from number crunchers to well-informed editors of the business story.
INTELLIGENT AUTOMATION TOOLS
These tools are better suited for small and medium-sized companies that don’t have the economies of a large enterprise. They provide BPM efficiencies, nevertheless. Our enterprise was fortunate to have the resources for an enterprise-ready solution that gave us the tools to perform the task. We also had the necessary personnel to see the project to a successful implementation. When you speak of BPM, there are many small and medium businesses that need BPM solutions but may not have the resources afforded to a large enterprise nor the time and labor force required.
Thankfully, BPM works nicely with intelligent automation tools, including RPA and robotic desktop automation (RDA). One such tool is Microsoft Power Automate. Power Automate is an RPA package available to both businesses and individuals, for personal use, through MS Office 365 subscriptions. Like BPM solutions, to start implementation, you need to first understand the process you want to automate, who owns the process, and the stakeholders who will provide inputs or use the output. It’s also important to ask certain procedural questions:
- Is the process fairly consistent or standard?
- Do you need to allow for exceptions (nonstandard)?
- Are there any risks to be considered if the process isn’t performed or is performed incorrectly?
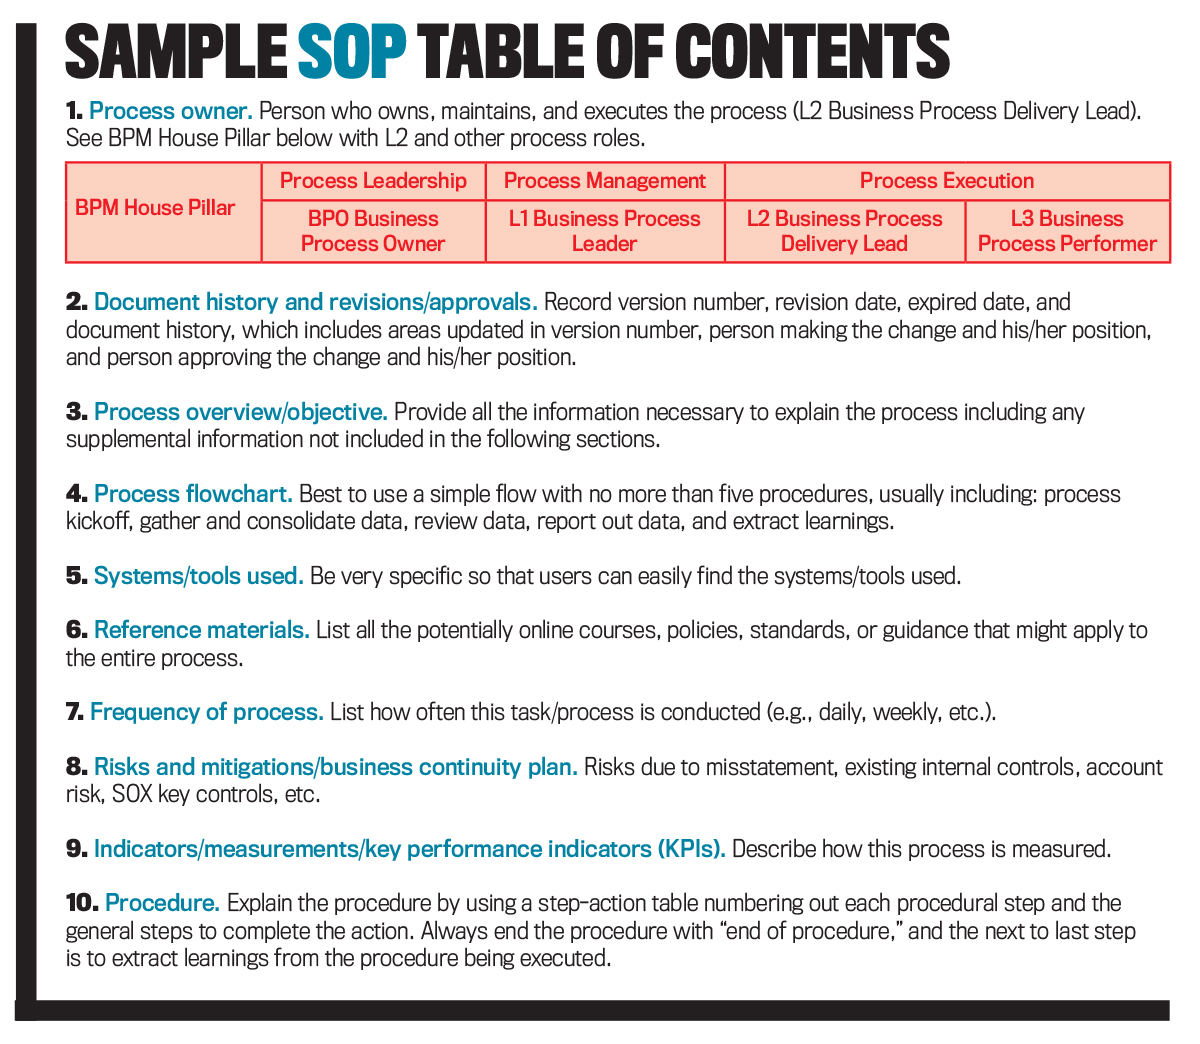
When going through this exercise, it’s important to document your findings in a standard operating procedure template, or SOP. The SOP describes the process and usually includes items such as process ownership, risks/mitigations, and procedures in the table of contents (see “Sample SOP Table of Contents”). The SOP should be written in a way that anyone interested in the process could understand, and it should be maintained and kept current by the process owner.
The difference between a process and a procedure is significant: A process is more surface level, and a procedure is a lot more detailed. The process is used by management to analyze the efficiency of its business, while a procedure includes the exact instructions on how the employee is supposed to carry out the job.
After completing your SOP, you can start to develop the Power Automate flow. The Power Automate software includes templates that you can use to capture the flow that best matches your process to improve the process efficiency and accuracy. No stones go unturned. When the template is completed, it’s next required to differentiate the electronic process to maintain the Power Automate flow (process detail map) from the human process (SOP).
The electronic process is somewhat like a macro in an Excel workbook. The process might be complex or just a simple repetitive process that makes work more efficient. For instance, you could set up a process to assist with storing attached documents in email to their respective location in a folder, such as a Dropbox folder. In that case, you would simply use the Power Automate template “Save Gmail attachments to a Dropbox folder” and specify the details of “which email” and “what Dropbox,” allowing access to your Gmail and Dropbox accounts, respectively. You’d get a notification from Dropbox that a document was just saved. The human process is generally used to initiate, execute, upload inputs, and utilize outputs, as needed. If the human process is detailed, you may need to create an additional desktop procedure document to accompany the RPA SOP.
ROBOTIC DESKTOP AUTOMATION
RDA, also known as attended automation, refers to a desktop bot or virtual assistant bot that lives on an employee or end user’s desktop. Not only does it drive efficiency and productivity, but it also helps to boost employee productivity and increase customer satisfaction.
RDA bots are useful for automating repetitive, high-volume business processes that require no human judgment—for example, extracting data from an invoice using optical character recognition. But most business processes involve tasks and decisions that call upon some human intervention. So where do you start with setting up an RDA? The starting point begins with an SOP for the required process to automate. After it’s tested, you can create the process detail map for the RDA and then an updated SOP for the human steps needed to manage the RDA.
BPM and intelligent automation mirror each other in that they allow an enterprise to implement enterprise-wide digital data transformation that will streamline the business process, bring continuity and consistency to business processes, enhance productivity, and make life that much more enjoyable because of it.
The information and opinions expressed in this article are solely those of the authors and don’t represent their employer.


