Distress and disruption caused by natural disasters or pandemics like COVID-19 have increasingly strong impacts on individual nations and the global economy. In today’s interconnected world, a single crisis can destroy infrastructure, degrade public health and workforce resources, and disrupt supply chains. These events, in turn, may lead to inflation and broad economic downturns. While some businesses may prosper during a crisis, many others may fail if they’re unable to react quickly to the changing environment.
Business resilience involves both taking advantage of unexpected opportunities and mitigating the damage from new threats. Organizations may need to modify their business models by engaging differently with customers and suppliers, realigning their workforce, accelerating their digital capabilities, and optimizing their asset base through divestitures or acquisitions. Financial structures may also need to be modified as credit markets change and public sector relief resources and incentives become available. In short, individual companies are in dire need of guidance on how to make timely decisions to survive the crisis and foresighted decisions to thrive afterward.
ADAPTING ON THE FLY
Examining business failure and resilience has been a perennial topic for academics, investors, and lenders. IMA® (Institute of Management Accountants) issued a Statement on Management Accounting (SMA) titled The Profitability Analytics Framework in November 2020 to provide a practical, high-level road map for management accountants to play a more active role in their organization’s strategic and risk management at all levels. The Profitability Analytics Framework (Figure 1) is a useful template for discussing various strategies to remain profitable and resilient.
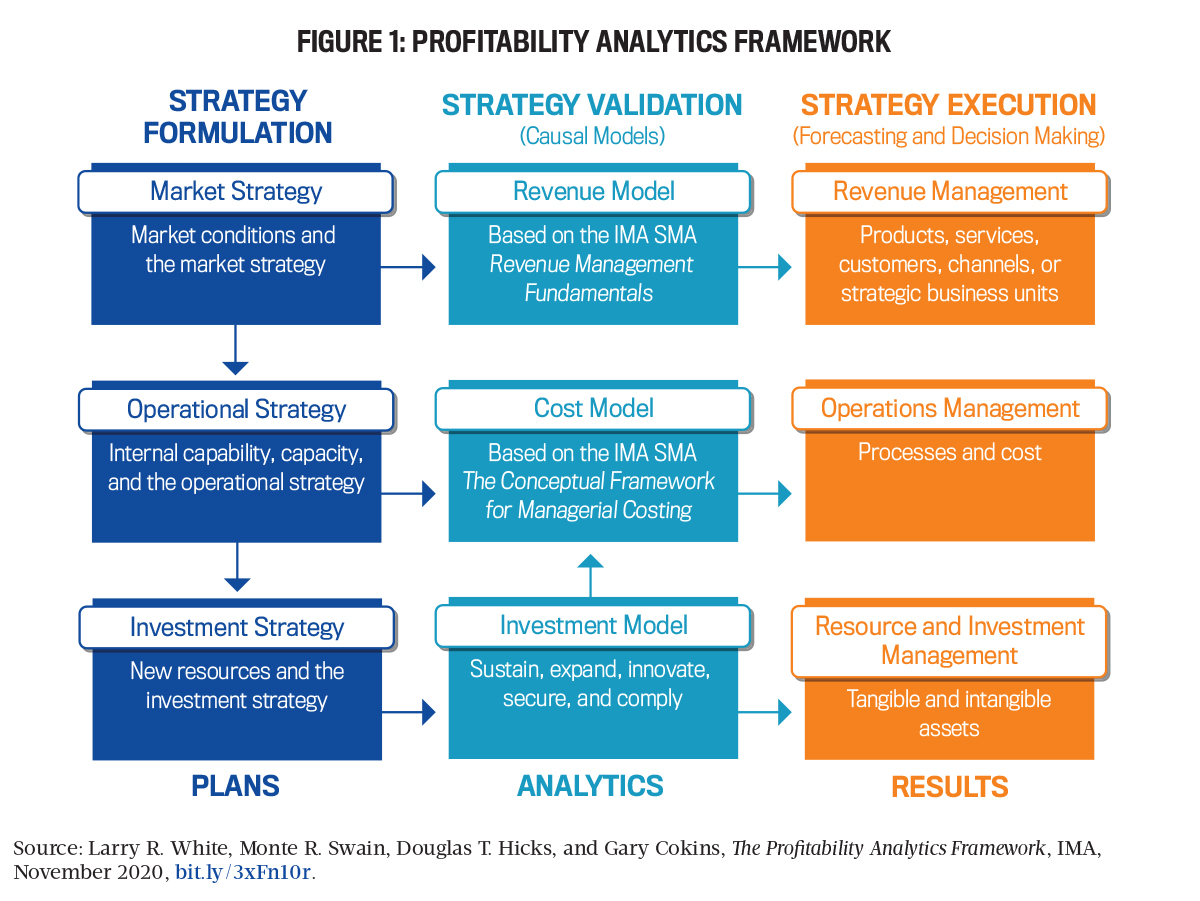
Starting with market strategy, a company must examine its products, services, customers, and channels from which strategic business units derive revenue. As always, the competitive landscape must be carefully considered at this stage. For instance, many restaurants modified their menus during the COVID-19 pandemic to offer meals that were better suited for takeout, modified their space to allow for more outdoor seating, or partnered with delivery services to make it easier for customers to get their products.
In the retail industry, many brick-and-mortar retailers quickly switched to e-commerce and provided delivery services or easy pickup options. And the education sector rapidly shifted to online learning, resulting in new products and skills in the workforce while overcoming long-term resistance on the part of many faculty, students, and employers. Textbook vendors with inadequate online materials found that they lost market share.
PLANNING FOR RESILIENCE
Businesses also need to address the resilience of their internal capabilities and operational strategies. One important lesson learned from the COVID-19 pandemic is the need for ongoing training in the workforce as well as flexibility in terms of hours and venues of work (home vs. office). Current labor shortages in some sectors have resulted in some companies reconsidering their hiring requirements and weighing the trade-offs between formal education and on-the-job training.
In addition to personnel shortages, supply chain bottlenecks have become one of the most difficult operational challenges for manufacturing, construction, and retail companies. While Just-in-Time manufacturing and low buffer inventories have been advocated for many years, supply chain disruptions during the pandemic led to serious work stoppages and revenue losses in many industries. Diversification of the supply chain will become increasingly important going forward, and businesses will need to seriously consider the trade-offs between sourcing locally, buying from a cheaper foreign source, or storing larger inventories in case of logistical disruptions.
Finally, many organizations will have to reconsider their financing strategy going forward. Low interest rates over many years have encouraged businesses to take on greater amounts of debt. But with rates on the rise, CFOs will need to rethink their companies’ financing strategies. In future down cycles, there may not be government stimulus funding or equal financing in every sector. In that case, even though stock buybacks were common over the past three years, businesses may need to maintain a greater cushion of cash reserves in order to remain solvent. That said, new technology and equipment will be needed to meet demand as well as challenges from competitors, which means that financing for these investments must be adequately planned for. Investor relations experts will need to make the case to the CFO for cash reserves, arguing that while extra cash may reduce current profits and return on assets (ROA), it may insure against risk during economic downturns.
AVOIDING FAILURE
To take any steps on the path to resilience, an organization must first avoid failure, which can be facilitated through an exam-ination of the Altman Z-score, one of the most widely used analysis metrics in business lending for more than 50 years. (See Edward I. Altman, Edith Hotchkiss, and Wei Wang, Corporate Financial Distress, Restructuring, and Bankruptcy: Analyze Leveraged Finance, Distressed Debt, and Bankruptcy, Wiley, 2019.) The components of the Altman Z-score can be easily derived from typical financial statements. They include:
- Working capital/total assets
- Retained earnings/total assets
- Earnings before interest and taxes (EBIT)/total assets (TA)
- Market value of equity/book value of liabilities
- Sales/total assets
Weighting these components, the Z-score model results in a score that typically reflects the company’s likelihood of default. The three Z-score ranges are:
- Z-score >2.99 = “safe zone”
- Z-score between 1.81 and 2.99 = “grey zone”
- Z-score <1.81 = “distress zone”
By keeping a close eye on these metrics, management accountants can conduct scenario planning on the model component ratios that result from the various marketing, operational, and financing strategies considered in the plans.
In their book, Altman, et al., discuss the common causes of business failure, including poor operating performance, lack of technical innovation, deregulation of key industries, high financial leverage, poor liquidity and funding shocks, and unexpected liabilities from litigation. It’s easy to see how these parallel the Profitability Analytics Framework. For example, unexpected international competition or loss of regulatory protection from competition may lead to business failure. Lack of technological innovation can result in the company being less competitive in the marketplace, either in product offerings, sales and distribution options, or operational efficiency and cost. Poorly executed strategic investing decisions, such as acquisitions that aren’t well integrated, can also lead to business failure.
Overcapacity as a result of poor marketing forecasts or unwise investing can lead to uncompetitive cost and price outcomes. External commodity price shocks that can’t be passed along to customers can lead to business failure; such cost increases may result in customers seeking substitute products or sourcing them from lower-cost countries. Other business failures fit into the “financing strategy” category. High financial leverage leads to a higher cost of capital and more financial risk in times of downturns. Even with short-term financing strategies, insufficient liquidity and cash reserves can also lead to failure if credit supplies unexpectedly dry up, as they did in the United States during the 2007-2009 downturn.
Finally, a robust enterprise risk management assessment is a key to avoiding failure, particularly in industries like pharmaceuticals and mining, where unexpected product or workplace lawsuits can lead to unforeseen liabilities and result in bankruptcy.
IMPROVING THE USE OF DATA ANALYTICS
Financial planning and analysis (FP&A) for resilience and adaptability in uncertain times requires a more sophisticated approach. In August 2021, IMA published another SMA addressing the use of more innovative data analytics in strategic planning. Overcoming FP&A’s Biggest Challenge: Predicting the Future provided updated insights on how to use data analysis to implement the Profitability Analytics Framework. Increasingly, organizations are developing (and sometimes sharing) nonfinancial data sources, which many management accountants typically haven’t used in the past, to assist in FP&A.
Combined with new data analytics tools, such as machine learning, this data may prove useful in forecasting sales as well as cost components to achieve more accurate financial planning.
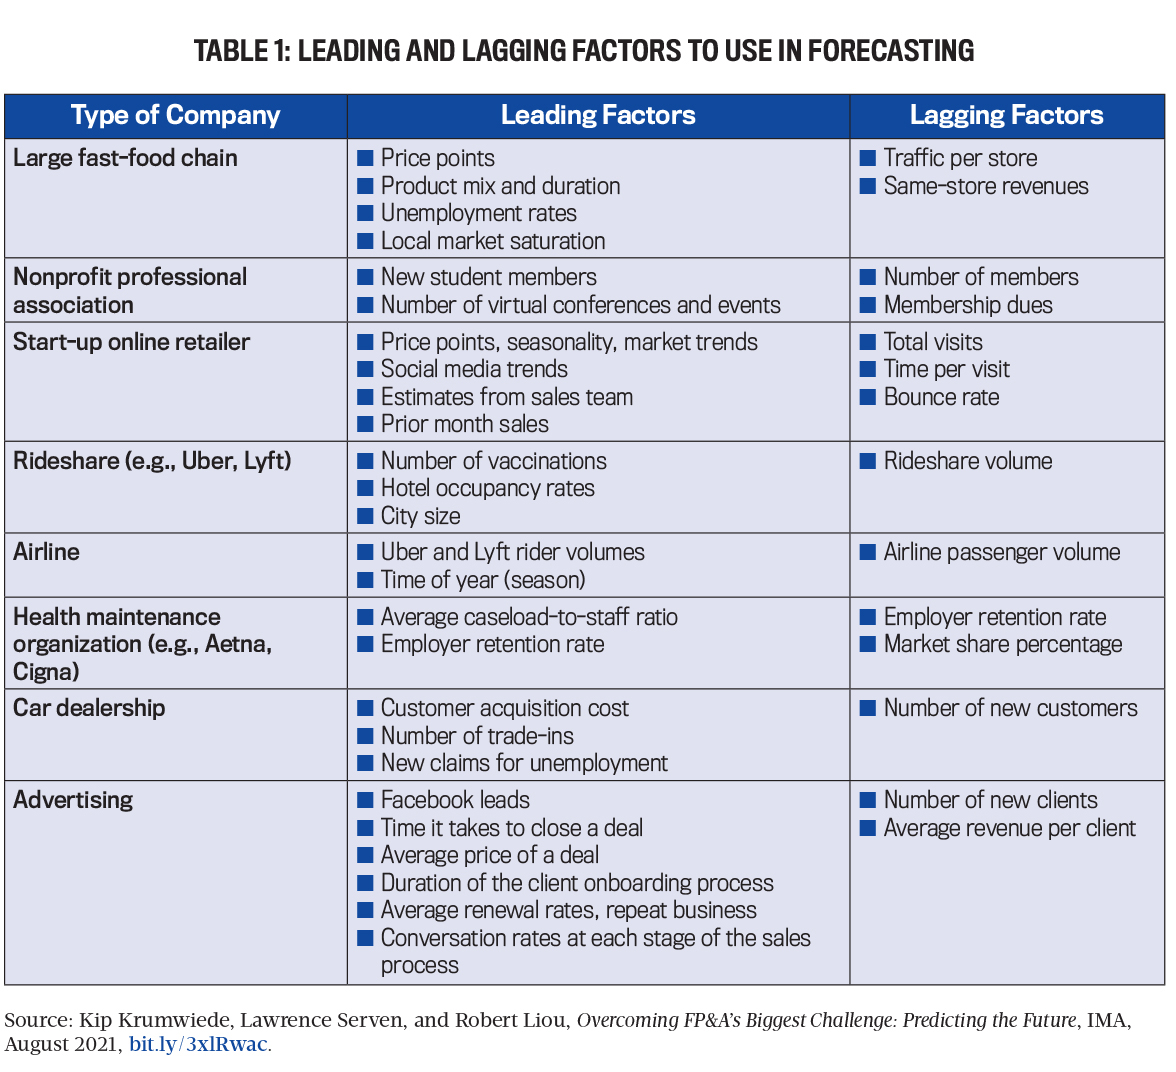
Examples of potential causal relationships in a sales forecast model for various types of companies are provided in the SMA and in Table 1.
In this new era of data analytics, management accountants are challenged to improve their skills and use more creativity in developing forecasting models. Many data sets can be found on the internet and social media. For example, Google News allows for queries on how many publications contain certain keywords on a given day. An analysis of this data could help accountants forecast demand patterns on specific days of the week or months within the year. Wikipedia provides daily visitor statistics per page. This information could be useful to detect trends in sales or costs, as well as additional information about new products or competition. Financial data for public companies in the U.S. is freely accessible on the U.S. Securities & Exchange Commission (SEC) EDGAR data site. Open-access programming sites can be used to develop a relatively simple method to download this data from the EDGAR site.
For more localized data, each U.S. state collects economic data provided by economic development agencies, local universities, city governments, and many nongovernmental organizations. Industry associations, tourism authorities, and think tanks around the world can also provide relevant data. Academic research, too, has provided many examples of using unstructured data to predict changes in stock prices, including using word sentiment analysis in blogs or forum posts, page views of Wikipedia to predict stock market declines, Google search volumes to detect stock market movements, and linking financial news to stock returns. Twitter feeds may be used to predict volatility of stock prices and abnormal stock returns.
DATA ANALYSIS TOOLS AND TECHNIQUES
Once a causal model has been identified, there are many analytical techniques that can be applied to explore the relationships between variables. Traditional trend lines, bar graphs, and linear regression analysis can be applied using simple Excel tools. Many companies also apply machine learning modeling techniques. One potential advantage of machine learning is that it can model complicated relationships compared to linear regression. For example, deep neural networks, a predominant model in state-of-the-art machine learning systems, are capable of modeling arbitrarily complicated relationships in theory, although the performance in practice is limited to the amount of data available and the affordability of computational resources.
The second advantage of machine learning techniques is that they can incorporate multimodal data, either structured (quantitative data in financial balance sheets, for instance) or unstructured (such as textual data from financial reports). For example, natural language processing can be useful to analyze investor earnings calls, text in regulatory filings, newspaper and media articles, and other documents. Fortunately, there are a lot of open-source programming resources that can be used to bootstrap the use of machine learning in a specific business situation.
In addition to forecasting, machine learning may be helpful in various process control and improvement initiatives. Most credit card companies use machine learning applications to detect fraud, and many job posting and filtering companies use machine learning to sort applicants and identify the most desirable candidates based on specified criteria. In fact, machine learning tools may lend themselves to any number of decision tasks or process characteristics.
MAKING RESILIENCY REAL
Our research draws on the two IMA SMAs to examine how organizations can be more resilient during times of economic crisis. Drawing on The Profitability Analytics Framework, we developed a series of causal hypotheses and possible data measurements for manufacturers that we could derive from published SEC filings. Table 2 provides many of our hypotheses, causal relationships, and data that we used to implement the Profitability Analytics Framework.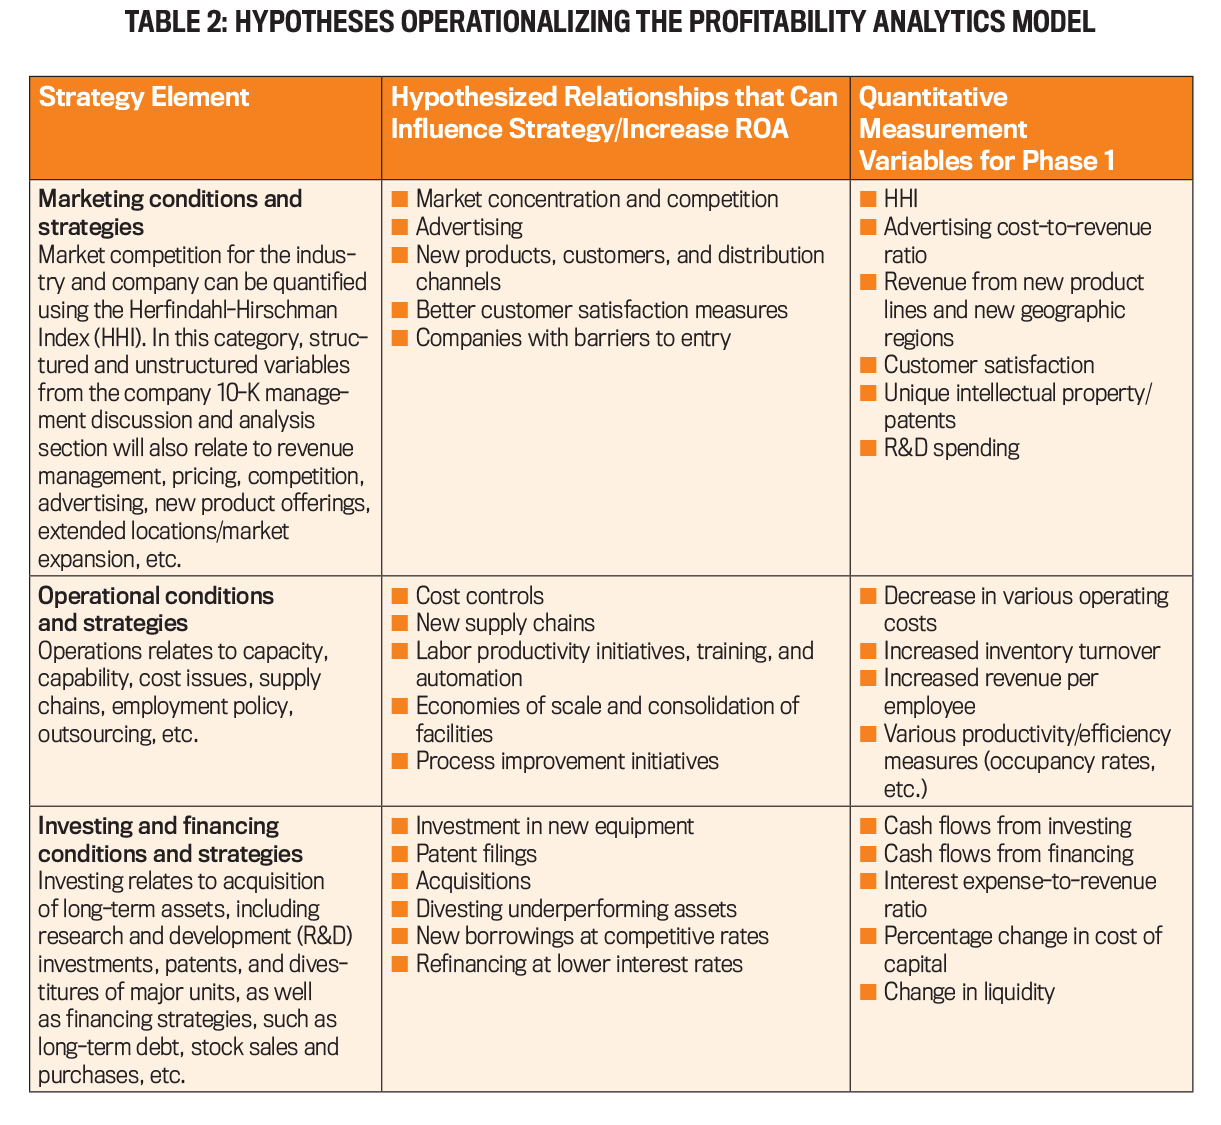
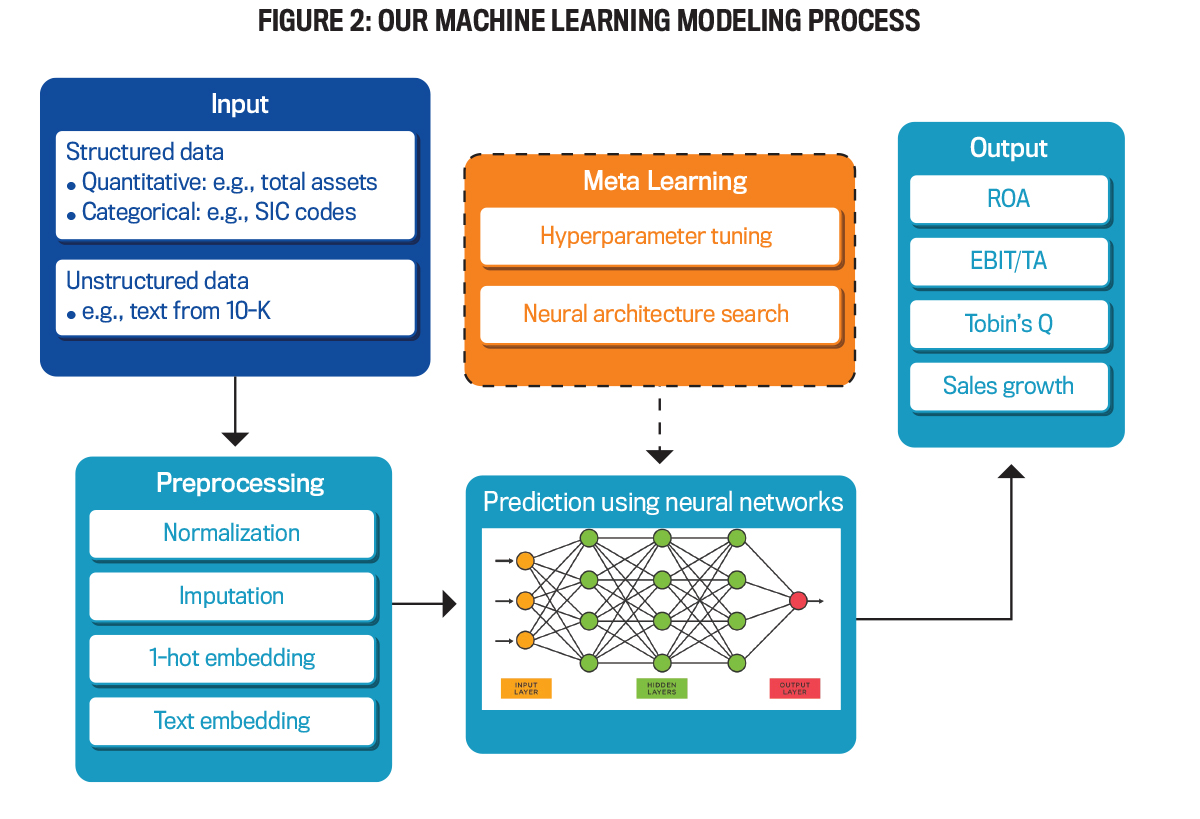
Figure 2 illustrates how the machine learning modeling process incorporates a variety of data and modeling methods. The input module takes in multimodal data, whereas the preprocessing module performs necessary preprocessing of the data. The prediction module trains a neural network model to fit the data. The meta-learning module tunes hyperparameters (step sizes in the training process, for example) and optimizes the architecture of the neural network (such as the numbers of layers and neurons). The output is ROA, EBIT/TA, Tobin’s Q, and sales growth.
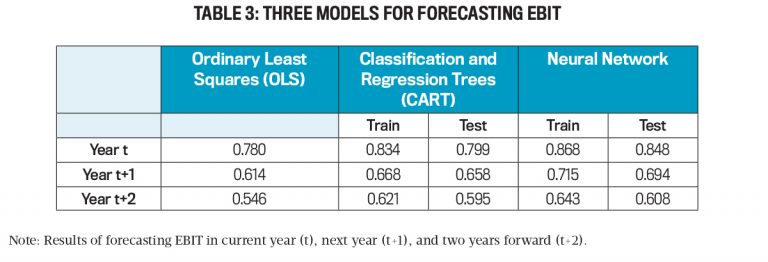
Using primarily quantitative (structured) data from the financial statements, our models allow us to explain about 86% of the current year variation in EBIT, 70% of market-to-book value, 70% of the variation one year in the future, and more than 60% two years in the future. Table 3 provides the results using ordinary least squares (OLS), classification and regression trees (CART), and neural network models, the latter of which are the most accurate.
THE IMPACT OF ADDITIONAL VARIABLES
We also incorporated variables created using unstructured data from the 10-K filings for 1996-2018. Using these and other data, we derived variables that represent (1) the impact of natural disasters on the company, measured by specific words from the 10-K (such as flooding, freeze, severe storm, tropical cyclone, wildfire, and winter storm) and (2) measures of business and economic stress exposure (such as disruption of operations, lower demand, employee layoffs, lockdowns, liquidity shocks, and supply chain disruption) and management responses (cost cutting, community engagement, digital transformation, and new product development) using the 10-K text and word dictionaries developed by Kai Li, Feng Mai, Rui Shen, and Xinyan Yan. (See “Measuring Corporate Culture Using Machine Learning,” The Review of Financial Studies, July 2021.)
We also incorporated variables created using unstructured data from the earnings call transcripts for 2001-2018. Using these and other data, we derived variables that represent measures of corporate culture variables from rhetoric in the earnings call transcripts, using words representing innovation, integrity, quality, respect, and teamwork, from dictionaries developed by Li and colleagues.
WHEN DISASTER STRIKES
While natural disasters marginally improved the explanatory ability of the models, the most useful part of our analysis was exploring how the interaction between the occurrence of disasters and various management responses affected company performance. Specifically, the interaction between disasters and the increase in inventory and capital expenditure, and long-term debt reduction, are significantly and negatively associated with EBIT, while the sale of investments is significantly and positively related to EBIT. Unlike results for ROA and EBIT, the interaction between disasters and the increase in inventory and capital expenditure is significantly and positively associated with the company’s market value (Tobin’s Q).
In addition, the interaction between disasters and advertising activities and increases in investments is also positively related to market value, suggesting that investors react favorably to these decisions. On the other hand, the interaction between disasters and sales of common and preferred stocks and other financing activities is significantly and negatively related to the company’s market value, indicating that investors don’t value these decisions. These results highlight the fact that the impact of management’s actions on accounting measures of performance, which are focused on past events, aren’t always consistent with the market’s assessment of the impact of these actions on future stock prices.
Our analysis shows that company actions, as measured by text analysis variables, in times of disasters influence performance in periods after the disaster occurs. Cost cutting seems to be the variable with the most consistent positive results for ROA and EBIT, as might be expected. If, however, the decisions are made during disaster years, they’ll hurt both current and future performance. In fact, the benefit of cutting costs is offset by the interaction between disasters and cost cutting. The analysis indicates that cutting costs during the disaster year will have a negative cumulative effect on ROA and EBIT. There were, however, opposite impacts of these actions on market-to-book performance—the analysis shows that cutting costs during the disaster year will have a positive cumulative effect on performance. Interestingly, we found that the impact on performance, as measured with accounting variables such as ROA and EBIT, was quite different from the impact on performance as measured by the company’s market value.
Over the past year, we’ve tested dozens of models with a variety of variables. We’re continuing to refine the models by obtaining additional text resources from earnings calls in order to more accurately measure the external exposures that companies face as well as their real-world actions and responses.
The perennial question of how businesses can improve their resilience to cope with significant economic shocks, as well as ongoing competitive pressures and challenges, is a key issue that deserves attention. With support from the IMA Research Foundation, we’re pursuing answers to how companies can better address this question using a variety of structured and unstructured data and machine learning analysis. Using nontraditional data sources and innovative analysis techniques, management accountants and other financial professionals can now deploy data-driven decision making to advance risk management and mitigation practices to a higher level.
What do we hope to accomplish through our research? In short, our desired outcome is to develop a better understanding of how to create more resilient businesses and economies using better business planning and forecasting to withstand severe and, as we’ve already seen as a result of the recent pandemic, unanticipated economic stress.
