Having joined the company in 2019, Greg Hoggard, CFO and vice president of finance and IT, observed, “During massive growth, it’s quite tempting to try to be everything for everyone. Rembrandt showed signs of losing its focus. With the investment in disparate satellite facilities, logistical advantages were compromised, the supply chain slackened, and resources were spread inefficiently across the business.”
PHASE 1: ACCURACY AND ACTIVITY-BASED COSTING
The Iowa site is home to six million hens, producing more than five million eggs per day. The eggs are conveyed to main egg belts where the eggs are washed, broken, separated, pasteurized, and processed. Though this in-line system enables Rembrandt to produce egg products and organic nitrogen-rich fertilizers at a highly competitive price, this process, which Hoggard inherited, was complicated on several fronts (see Figure 1).
First, to count all the eggs produced by the hens, Rembrandt uses analog counters, which register an egg when anything passes under the sensor. There are 80 analog counters per barn and 20 barns at the site. Egg counts are then recorded in the enterprise resource planning (ERP) system. These analog systems prevalent in the egg industry today cost millions of dollars to install and maintain. The problem: The counters are prone to error.
Rembrandt must also weigh its eggs, as no two eggs are the same. It would be impossible to manually weigh every single egg produced at the farm. To estimate egg weights, Rembrandt performs test weights daily. Employees randomly choose 360 eggs (one case) and weigh the case on a mobile scale. Test-case weights are averaged for each barn and recorded in the ERP system. Test weights are multiplied by the number of cases counted by the analog counters to arrive at total shell pounds for each barn for each day. Barn yields are measured by total shell pounds produced divided by total feed pounds consumed.
Finally, after an egg is laid, it travels on a conveyor belt system through a washing machine and a breaking machine. Here the egg is cracked and separated into albumen (egg white) and yolk. Shells are discarded. Whites and yolks pass through flow meters to determine the amount of liquid egg pounds that successfully made the trip from the barn through the breaker. Breaking plant yields are measured by total liquid pounds produced as measured by the flow meter divided by total shell pounds calculated in the barns.
When the process was followed daily, this mixture of math, science, and assumptions yielded seemingly good results. While it wasn’t certain where loss was happening, an answer could be derived—or divined—from the parts. That said, organic life inevitably presents variety. While many things can be done to minimize variation, it’s a challenge to keep accurate track of how much is being produced. To bring the process into order in a way that can be reliably measured and tracked requires creative minds employing assumptions or data.
A FOCUS ON METRICS AND DATA
Despite (or perhaps because of) the natural variations we discussed and the complex data collection process, there continued to be a large discrepancy between measured factory output efficiency and actual financial performance. Rembrandt’s management was convinced the problem lay in incorrect standard costs.
Hoggard and his team committed to implementing activity-based costing. Time studies were performed by the supply chain and continuous improvement teams. Bills of material were validated to ensure proper material usage. Production throughputs and overall equipment effectiveness were calculated and worked into labor, variable, and fixed overhead absorption rates. Standards were validated or updated in the ERP system. Cost accounting was tasked with tracking production variances to standards daily and sharing the results with management.
Simultaneously, Rembrandt replaced its legacy flow meters in the breaking plant with high-end Coriolis mass flow meters. These flow meters are specially designed to accurately measure viscous liquids containing entrapped gas bubbles, as one would find in eggs or ice cream. After calibrating and troubleshooting these flow meters, Rembrandt was able to confirm with high confidence the amount of liquid egg produced in the breaking plant and delivered to the food manufacturing division.
A large hurdle was discovered at this point. After installing the new flow meters, the company identified gross misstatements in shell pounds produced. The flow meters had just been calibrated and verified for accuracy, but why would that affect the number of shell pounds produced? The accounting department was tasked with following the data through the existing system.
It found that an assumption had been coded into the existing system, forcing an 82% yield at the breakers. This appeared to have been done in 2015 in response to the avian influenza crisis. This code was removed, and Rembrandt was back to using the analog counters and test weights to derive shell pounds. This resulted in the breaking plant showing much lower yields than previously reported. It was closer to the truth, but no one wanted to believe it. Months of discord between operations managers, executives, and accountants ensued.
You have probably heard the phrase “You can’t manage what you don’t measure.” But the converse is also true: You can’t measure what you can’t manage. In the case of Rembrandt, the managers were all convinced that they were doing their part to enable success. After all, where a scorecard existed, it showed cost savings in the millions, with goals being exceeded or met. Yet Rembrandt continued to reel financially.
PHASE 2: INNOVATION AND COMPUTER VISION
In November 2020, Hoggard found his way to some answers after attending the 2019 IMA® (Institute of Management Accountants) Annual Conference & Expo in San Diego, Calif., where he was seated next to data scientist Daniel Smith during a lunch roundtable. They exchanged LinkedIn contact info, and Hoggard subsequently attended Smith’s session on how to build your own blockchain in Python.
When Hoggard viewed a video in which Smith demystified AI facial-recognition software, the light bulb went on. He invited Smith to help devise a solution for Rembrandt. It seemed clear now to Hoggard: If cameras can count and recognize faces, surely they could count eggs.
Now that Hoggard and Smith had teamed up, the first step toward organizational adoption of technology was to prove the technology works: the proof of concept. But equally as important, the first step toward lasting organizational change—technological or otherwise—was changing the culture of leadership.
In a crisis, managers often forgo building or maintaining sustainable process-based solutions and opt for temporary shortcuts to survive the day. Rembrandt was guilty of this during the 2015 avian influenza. Process was discarded and data governance ignored. The future was leveraged to survive the present.
But following a crisis, a business faces a decision. Does it continue to delay productivity in order to document legacy processes while designing and implementing new ones? Or does it let the employees solve problems as quickly as possible so the business can be profitable again?
THE CYCLE OF TECHNICAL DEBT
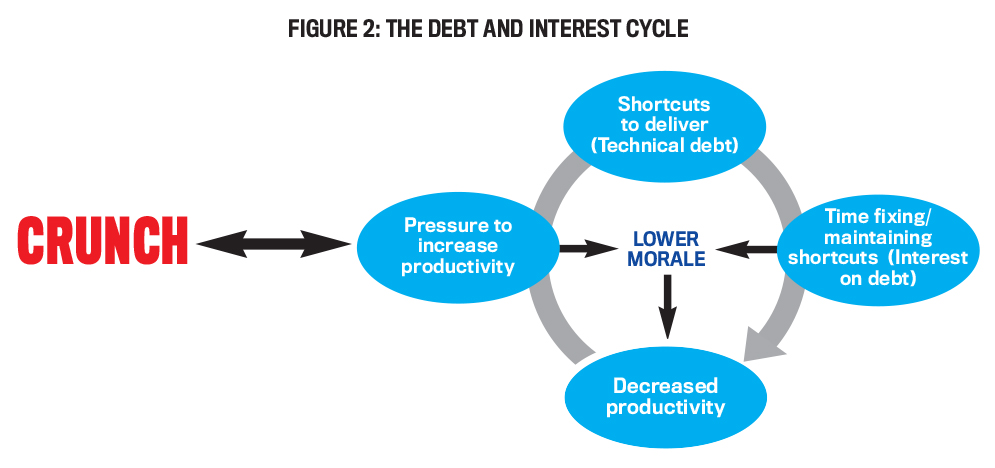
People go through a similar calculus every day, borrowing time from the future to save time now. The result is technical debt in an attempt to accelerate the development of technical solutions (and one could argue that most solutions in modern business are technical). In this way, technical debt accumulates when companies apply suboptimal solutions, such as repairing a slipping belt without documenting how to perform the repair, in order to successfully deliver on time, requiring additional resource allocation.
In a scenario like this, when the issue reemerges, the repair solution will have to be determined all over again. Thus, the accumulation of additional time and effort to support previous suboptimal solutions (i.e., “shortcuts”) is known as the interest on technical debt.
As the cyclical nature of the resources lost to debt and interest expands, the perception of reduced productivity (despite that overallocation of resources) creates lower morale as well. Low morale leads to turnover, creating even more work—and even more technical debt (see Figure 2). This is known as crunch culture.
PROOF OF CONCEPT
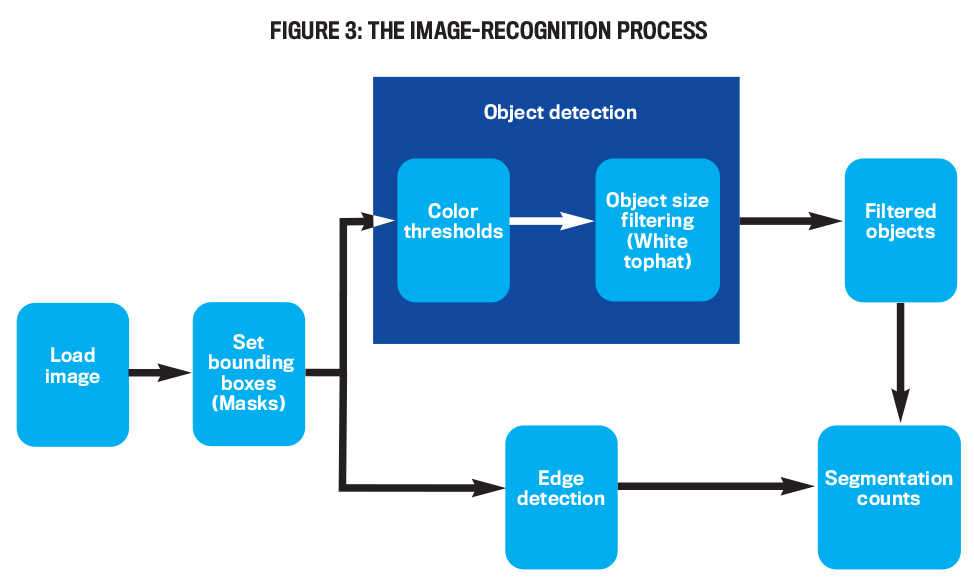
Although a robust, deep-learning image-recognition solution would eventually produce the most accurate results, Rembrandt selected a more traditional image-segmentation technique for the first phase of its new egg-counting image-recognition process because the company’s data storage and processing facilities were on-site rather than in the cloud (see Figure 3).
Image segmentation means dividing an image into different parts and then counting the segments that are relevant to whatever you want to count. In Rembrandt’s case, image-recognition process segmented white circular objects from everything else, then counted the white circles.
More specifically, the process is split into object and edge detection. Edge detection identifies the borders around objects, which in more advanced applications can also be used to identify object size, for example, calculating egg yields based on egg volume. For the proof of concept, however, a simple formula identifying where pixels suddenly changed from bright to dark was sufficient. The threshold for said change was determined through millions of model iterations, that is, “model tuning.”
Object detection has more steps but is a simpler process. First, given threshold values determined in model tuning, the grayscale image is set to either black or white. Then any white object below a given-size variable (also determined in model tuning) is filtered out. The size filter prevents artifacts like dust and water spots from being registered as eggs.
Finally, the identified objects are overlaid with the detected edges. The edges segment any clusters of eggs that would be counted as one object otherwise.
This process was able to achieve more than 98% to 99% accuracy in ideal conditions, but the model wasn’t as effective in real-world conditions. Shadows and bright lights prevented edge identification, moisture that condensed on the camera was counted as a single large egg, and other unavoidable conditions caused accuracy to fall to around 95% when the model was put into practice.
Ninety-five percent accuracy was still better than the previous solution, but Hoggard and Smith knew they could do better.
PHASE 3: DEEP LEARNING SEGMENTATION
Presenting the successful proof of concept facilitated a larger discussion with leadership on the detriment of crunch culture and technical debt. Once the entire team understood that their individual efforts to help the organization could collectively damage the organization instead, it was quickly agreed they should proceed with Vision 1.0, the next proposed phase.
The next phase of image recognition was to increase accuracy in variable conditions and to determine the weight of each egg. To accomplish such a complex task required deep learning, specifically R-CNN (region-based convolutional neural network), an algorithm sequence specifically designed to segment and size objects in both image and video.
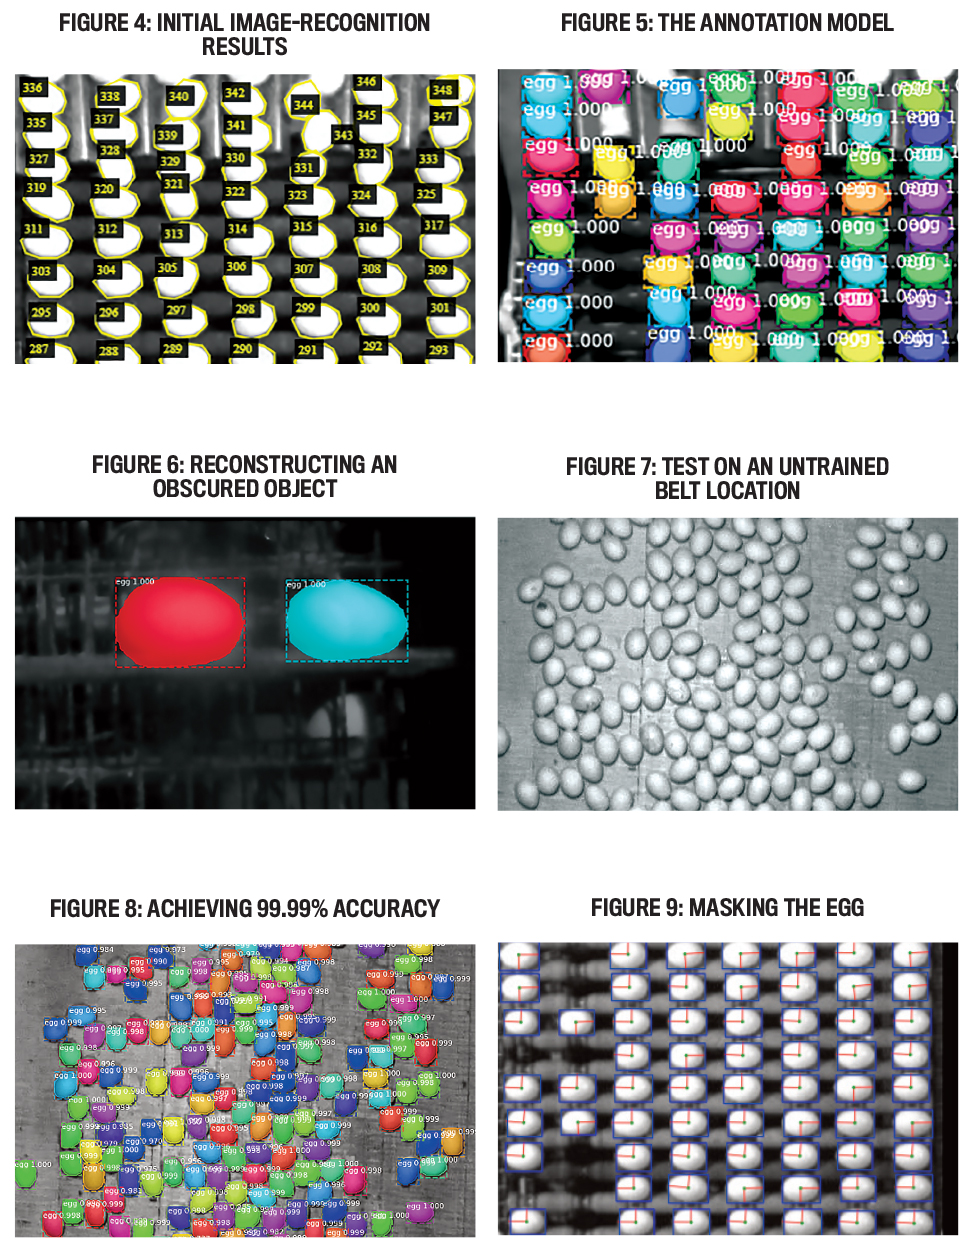
Dozens of images were painstakingly annotated by hand, with some images containing hundreds of eggs (see Figure 4). All the effort was worth it when the new model began producing results (see Figure 5). Hundreds of eggs could be counted at once in multiple locations in any condition. The model even predicted the size of eggs when they were partially obstructed (see Figure 6) and started to learn how to identify eggs in new contexts (see Figures 7 and 8).
Most important were the masks covering each egg (see Figure 9). The masks indicate the area occupied by each egg within the image. Because eggs are vertically symmetrical and because they always lie sideways, any image of an egg shows its widest and longest cross section. With this information, it was possible to train a model to predict the weight of each egg.
THE OUTCOME
It took a little time to get the company on board with this new approach to counting eggs. “We found some very strong allies in the manufacturing controls group,” Hoggard says. “That group reported into the operations manager. They were critical in helping to get buy-in from the operations team, especially Adam Hoogeterp, Rembrandt’s process controls supervisor, who immediately recognized how the new approach could positively transform their controls and monitoring capability. Adam and the controls group sourced the cameras and used 3D printing to custom-build mounting brackets, and Smith, controls, and the IT group tested and did troubleshooting on the algorithms programmed to count the eggs. Within a matter of three months, we had an AI camera system (that we subsequently named ‘Vision’) counting eggs at 97% accuracy. Three months later, Vision continued to learn and could then count at a rate of 99.8% accuracy.”
Two weeks after Vision was turned on, Marc Oleson, Rembrandt’s IT manager, and his team built a dashboard with stellar visualizations using Microsoft Power BI. Not only could Vision count eggs, but it could also derive equipment efficiency in near real time, an unforeseen benefit of the project. Oleson presented two weeks’ worth of data in a simple but effective visualization showing throughput by hour. “My initial response was ‘This looks horrible!’” Hoggard recalls. “[Oleson] was taken aback and asked whether he and his team did something wrong with the data. I clarified my response. The visualizations were wonderful. What they showed were hours of wasted time at the most labor-intensive process across the facility.”
Oleson and Hoggard decided to share the visualizations with the operations and executive teams without subscript or translation. “The data told the story. Anything we would have said would have lessened the effect.” Within two months of making the visualizations available, three hours were removed from the daily breaking plant schedule through hard work and effort from the operations team. The change enabled Rembrandt to utilize the current workforce to fill all open positions, eliminating the need for temporary labor in a very challenging labor market.
On top of that, since turning on Vision, the breaking plant yields have increased six percentage points. The environmental impact of reducing 6% of waste in a facility the size of Rembrandt is equivalent to 360,000 eggs per day!
WHAT’S NEXT
Rembrandt still weighs cases of eggs to arrive at shell pounds. But Vision 2.0, currently under development, will have the capability to calculate shell pounds and expected liquid pounds for each individual egg. Thus, key performance metrics will drive assumptions, freeing up more employees to do better and more fulfilling work uncovering more opportunities for profitability and growth.
“This combined effort, starting with commitment to technology, visualizations, and data, has helped us determine where tangible loss was happening,” Hoggard concludes. “Without it, no one, not the frontline employees, nor the managers, nor the executives, knew where to focus and what to change. We were victims of a crisis that occurred seven years prior. We’d been putting out fires ever since. AI, visualizations, and data have given us the courage of conviction to double down on change management in areas of the business that presumably had been functioning as desired, but truthfully weren’t. We still have a long way to go to reach all our financial goals, but we’re on the right path. We’ve gone from red to black…. If you’re curious about the payback of Rembrandt’s investment in this project, the answer is 18 days. I expect returns to be in the millions for some time to come.”

February 2022


