When students are first taught about using data to make business decisions in introductory accounting courses, they’re frequently handed a clean data set—without errors, duplications, or irregularities. Yet data rarely arrives clean in the real world, and business professionals and accountants often spend significant time preparing the data before it can be analyzed. To expose students to the challenges of data preparation, we believe it’s important to introduce the extract, transform, and load (ETL) process into introductory accounting courses.
The first step of the ETL process involves extracting, or obtaining data, from multiple sources, such as Excel, Access, Word, SAS, or even the web. This extracted data is loaded into a “data warehouse” (a single data source) where that data is transformed. Transforming the data involves cleaning it and combining/joining it, as appropriate. Calculations of the data might also be necessary at this stage. The last step in the ETL process involves loading the data into software, such as Excel, Power BI, or Tableau, which can then be used in decision making and data visualization. In short, ETL is the foundation for data analytics and is the first and often most important step in the data-analysis process.
Without properly extracting, transforming, and loading the data, data analysis can’t be completed accurately. As such, we believe it’s important to help accounting students understand that data is rarely clean, and that the ability to efficiently analyze information for effective business decision making requires completing the ETL process. Teaching this can occur in any course that involves data analysis, but students are probably best served first encountering this topic in introductory accounting courses.
ERRORS AND INCONSISTENCIES
The transforming component of the ETL process involves cleaning the data, or removing errors and inconsistencies, including irrelevant data, duplicate records, irregular (or inconsistent) data, missing data, and outliers.
Irrelevant data is unrelated to the business situation at hand and can make analysis more complicated and less clear. It should be removed from the data set. For example, if your team is analyzing whether a product line should be dropped, don’t include costs that will be incurred whether or not you ultimately decide to continue or eliminate the product line, such as the CEO’s salary or the cost of insurance on the administrative building.
 Click to enlarge.[/caption]
In addition to superfluous data, there may be duplicate records, which need to be removed from the data set because they slow down analysis and eat up storage space. There’s also the danger of giving too much weight to the duplicate records, which could skew the results, potentially triggering incorrect conclusions.
Irregular (or inconsistent) data needs to be standardized to be useful for analysis. Spelling errors in the data set need to be corrected and inconsistent capitalization standardized. For example, the state of Ohio may be listed as “OHIO” in one record and “Ohio” in another. The inconsistent capitalization is an issue, because a computer may not recognize “OHIO” as equivalent to “Ohio,” which may cause some records to be left out.
Names for items need to be consistent throughout the data set as well. For instance, the Human Resources department may be referred to as “Human Resources” in one record, while it might be listed as “HR” in other records. These different names for the Human Resources department will cause those records not to be grouped together for analysis. Naming conventions need to be standardized and consistent.
Missing data, including missing cells, blank spaces in text, and/or blank records, needs to be resolved prior to analysis. The missing data may be due to human error or another reason, such as a glitch in the automated process that originally captured the information. A decision will need to be made as to whether the record connected to the missing data can be fixed or if it should be removed from the data set.
Data outliers are records that are far outside of what’s normal for a particular item. For example, the pounds of cheese processed each day at a local creamery may range from 1,000 to 2,000. If a record shows 3,200 pounds processed in one day, that should be a red flag worthy of further examination. If it isn’t an error, however, the manager needs to decide whether that value should be included in the data set.
Once all the data issues have been resolved, the data needs to be examined one more time to confirm that it’s valid and reliable. Initial results from using the data should be carefully analyzed to ensure that the data is of high quality and that the results make sense.
CHOOSING THE RIGHT TOOLS
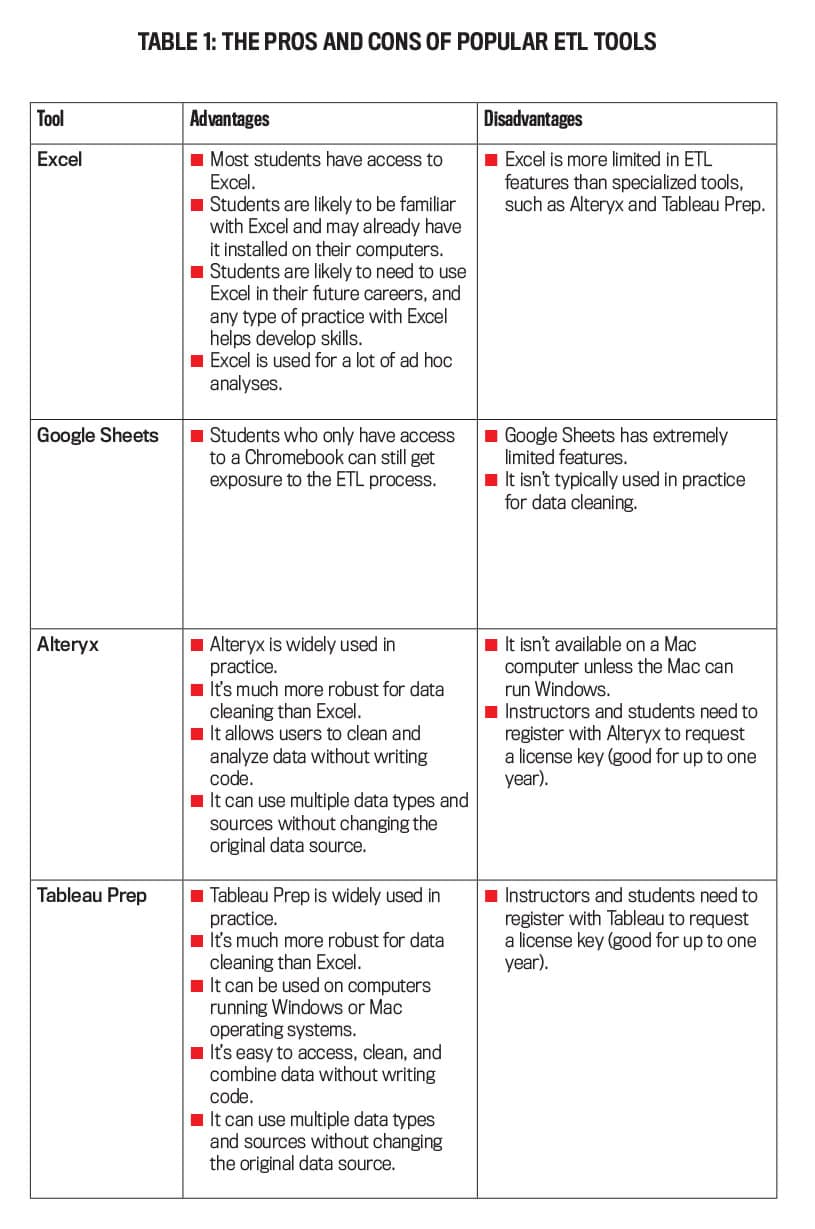
There are several different tools that can be used during the ETL process. During the transformation step, these would include Excel, Google Sheets, Alteryx, and Tableau Prep. As you can see in Table 1, each of these tools has its own unique advantages and disadvantages, but they’re all free and easily accessible for academics and students to use for educational purposes. Let’s begin with a favorite of many accountants—Excel.
Using Excel for data cleaning in class gives students another opportunity to further develop their Excel skills. Because most students are already familiar with the software, the emphasis of any data-cleaning project can be on the data-cleaning process itself, rather than on teaching students to learn to use new software. On the other hand, specialized ETL data-cleaning tools, such as Tableau Prep or Alteryx, are more efficient than Excel for data cleaning. While using Excel to teach data cleaning in an introductory accounting course is appropriate, a specialized data-cleaning tool would be more relevant in upper-level classes.
Google Sheets is another tool that can be used to teach data cleaning. While extremely limited in its features and not normally used in practice, Google Sheets provides an alternative software tool for students who don’t have access to Excel or have computers that won’t easily run Microsoft Office, i.e., a Chromebook.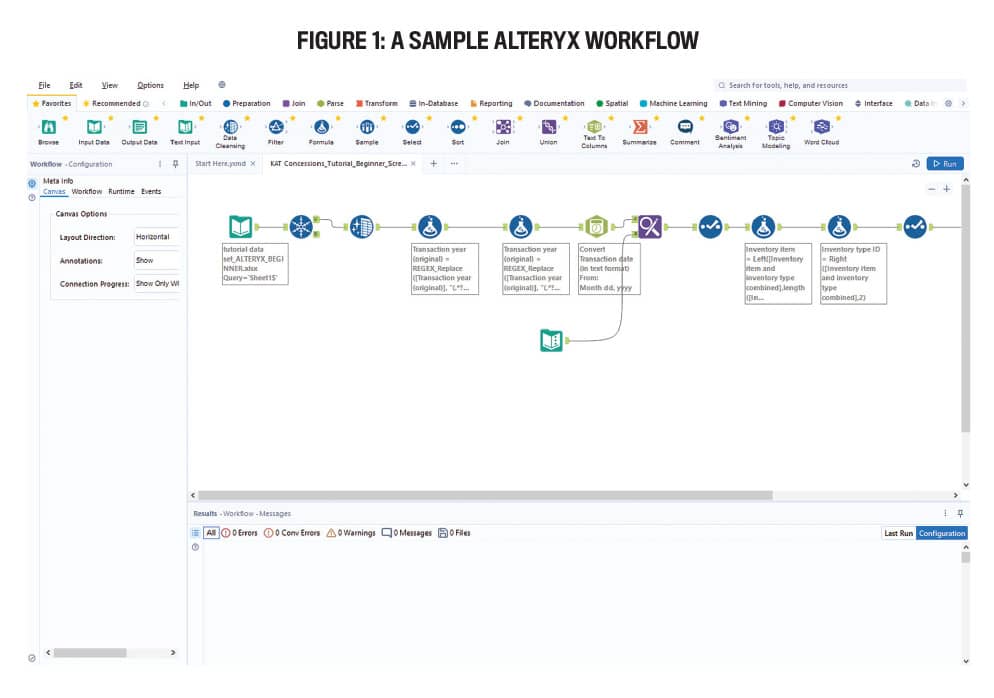
Alteryx is an analytic process automation platform that allows accountants to extract, transform, and load data using no-code building blocks. Data can be extracted from multiple sources, including Excel spreadsheets, Word documents, and the web. Once data is extracted, it can be cleaned in a variety of ways, including removing duplicate records, eliminating unwanted characters, converting text fields to data fields, and finding and replacing text. All these steps can be completed by building a workflow without using code. The final output can then be compiled in an Excel file, which can be easily loaded into visualization software such as Power BI or Tableau. Once a workflow is developed (see Figure 1), it can be used repeatedly on similar files without having to rebuild the ETL steps.
Alteryx provides educators and students a free one-year renewable license that’s available for download from its website after an account is created and the user’s eligibility is verified. For businesses, Alteryx is available for either individual users or multiple licenses; pricing can be found on its website. It’s important to note that the Alteryx software can’t be downloaded and used on a Mac unless the Mac can run Windows.
Finally, Tableau Prep, part of the Tableau suite of products, can be downloaded for free directly from its website. Licenses are valid for one year and are renewable for educators. Although Tableau Desktop includes some basic data-cleaning and preparation functions, Tableau Prep is designed to help the user clean and curate the data before it’s analyzed. It can extract and combine several types of data, such as PDFs, text files, Excel files, statistical files, Dropbox, and Tableau Server.
Tableau Prep also offers many robust data cleaning and preparation options that can be executed easily. Examples include splitting fields, creating calculated fields, group-and-replace functions, filtering, field formatting, and pivots, which rotate the data from rows to columns, making the data easier to work with.
RESOURCES FOR TEACHING ETL
We realize that many accounting educators recognize the importance of teaching data analytics and ETL skills but are often overwhelmed and unsure of where to begin or find teaching resources. This need was the impetus for developing our website, Accounting is Analytics, through which we share several projects we’ve developed and integrated into our own introductory accounting classes. Our most recent project, KAT Concession Supply, which is under the Analytics tab, focuses on data cleaning.
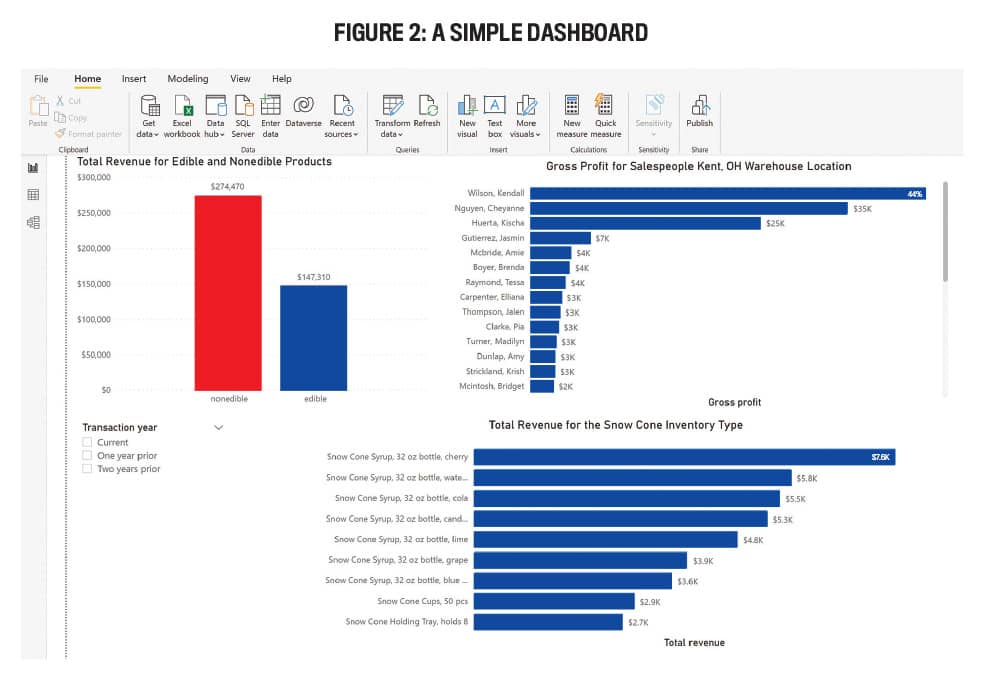
Our website currently includes a total of 10 ETL projects with accompanying interactive dashboards that are designed to be used in introductory accounting courses. Each project requires students to use Excel, Google Sheets, Alteryx, and/or Tableau Prep to clean a “dirty” data set with the assigned tool and then create a small, interactive dashboard with the cleaned data using Excel, Google Sheets, Power BI, or Tableau (see Figure 2). To find the projects, go to our website and click on one of the four tabs at the top of the page: Financial Accounting, Managerial Accounting, Analytics, or Emerging Tech.
All 10 projects are independent and can be used interchangeably. They’re available with three skill levels (beginner, intermediate, and advanced) and in four software combinations: Google Sheets (beginner only), Excel, Alteryx with Power BI, and Tableau Prep with Tableau.
The beginner project has fewer and less complex cleaning steps and includes only two visualizations. The intermediate version has additional cleaning steps with more complex requirements and involves three visualizations. Lastly, the advanced version involves transforming multiple types of data (including text and PDFs) and building four visualizations. We designed these projects keeping flexibility for the instructors in mind.
We suggest faculty assign these projects as homework, as they require no prior knowledge. The step-by-step tutorial videos walk students (and instructors) through each piece of the project to ensure success. The beginner projects take 20 to 30 minutes to complete, while the intermediate and advanced projects take 45 to 60 minutes.
We typically require students to answer the questions provided in our course management system. Students may also submit screenshots of their dashboards. After the projects have been completed, we spend about 15 minutes in class going over them.
FAKE COMPANY, REAL LESSONS
Our ETL projects use data sets for a fictitious company, KAT Concession Supply, which supplies food, paper products, and other items to fairs, amusement parks, and other organizations. Each of these free ETL projects uses a different data set (same fields, different data) that the instructor can edit. Each of the main data sets contain about 300 records.
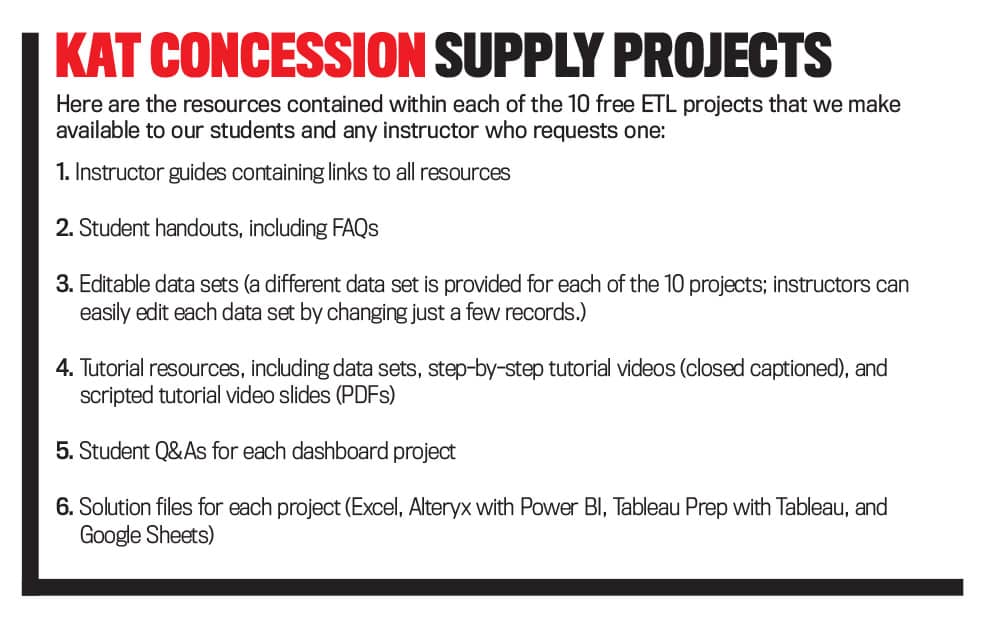
Resources for these projects include step-by-step tutorial videos—closed captioned and accompanied by scripted tutorial video slides (PDFs)—for each part of the ETL and dashboard projects, as well as teaching notes, data sets, and more. Additionally, a student guide is provided for each project, which contains an introduction to the project, software-download instructions, links to data files, questions to answer, and frequently asked questions. All of the projects are completely turnkey, making adoption easy. (See “KAT Concession Supply Projects” for a full list of provided resources.)
The software companies also provide robust support websites with videos. For example, the Alteryx SparkED education program provides free educational software licenses for students, along with cases for classroom use, certification, badging, and a community of support.
These brand-new, class-tested projects are ready to be used in introductory accounting courses, including financial accounting and managerial accounting. The intermediate and advanced projects might also be appropriate for upper-level courses such as accounting data analytics or a capstone course.
KAT Concession Supply interactive dashboards provide students with a successful first experience with Excel, Google Sheets, Tableau, and/or Power BI and make their next experiences with data analytics tools less formidable. Instructors can view these cases as stepping-stones to more advanced data analytics projects in upper-level business and accounting courses. To receive the Instructor Guide, go to our website, locate the project you’re interested in, and fill out the short request form. (Materials are sent about once a week; make sure to check your spam folder if an email hasn’t been received in a timely manner.)
IMPLICATIONS FOR EDUCATORS
Incorporating ETL into an introductory accounting course demonstrates to students that accounting is more than just debits and credits. Students often view accounting as solely about recording transactions and don’t understand that a key component of accounting is being able to use financial data to answer business questions. To fill this gap, ETL projects help students understand how financial data is used to solve business problems.
Data literacy and developing data agility are important skills for all business students. The projects that we’ve built include two technology skills: data cleaning and data visualization. Learning how to use data-cleaning tools, such as Alteryx, Tableau Prep, and Excel, will help students understand that the ETL process is the first step toward better decision making.
As we mentioned earlier, after cleaning and loading the data, students are asked to create a dashboard that includes two to four visualizations, depending on the level of project (beginner, intermediate, or advanced), using either Excel, Google Sheets, Power BI, or Tableau. Students learn how to analyze data efficiently using these data visualization tools, which can be tailored for communications. Learning how to communicate numbers via data analytics visualization is a prime skill for any accountant.
ETL and data analytics are critical tools for today’s accounting professionals. In a rapidly changing business environment, educators must develop a strong foundation for students to become technologically agile and confident with emerging technologies as they enter the workforce. Utilizing ETL projects, specifically the KAT Concession Supply projects, will not only help students to develop technology skills to clean, analyze, and visualize data but also provide them with cutting-edge analytics and accounting competencies that support critical business and professional goals.
August 2022


