IMA®(Institute of Management Accountants) members no doubt faced new and unexpected challenges brought about by the pandemic as well as its effect on business and economies around the world. This year’s global salary survey not only analyzes and compares member compensation and employment characteristics globally and across regions, but it also delves into the unique factors of 2020 and how IMA members across the globe have been impacted by the changing economic landscape.
Please be aware that the results represent the survey respondents and don’t necessarily reflect the whole population of accounting and finance professionals. Readers should be cautious about making comparisons of their salary to global, regional, or even same country results, as they’re highly affected by the demographics of the respondents.
GLOBAL REPRESENTATION
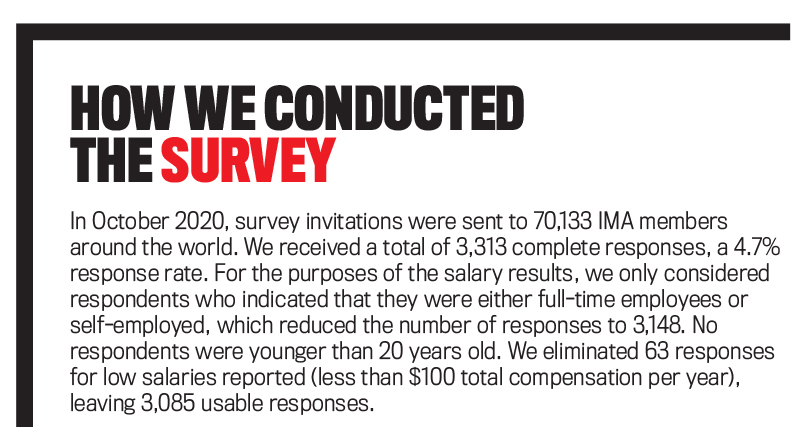
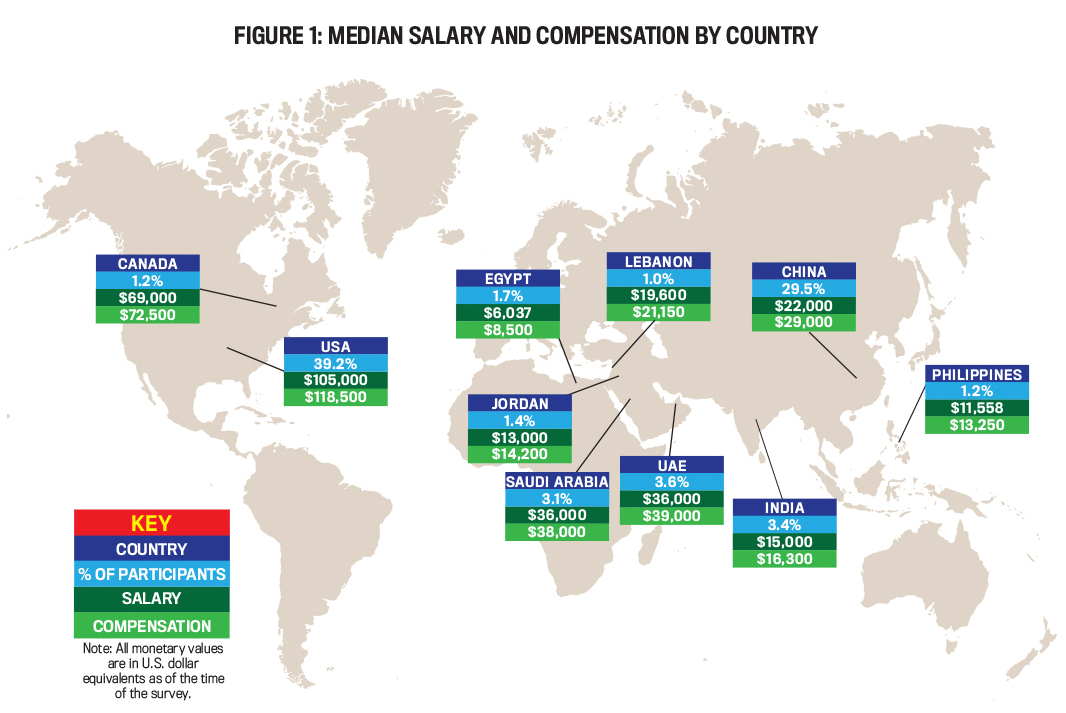
The total number of participants in this year’s survey is 3,085, representing 79 different countries. The median salary and total compensation for all countries with at least 1% of the survey responses are presented in Figure 1 (all monetary values are in U.S. dollar equivalents as of the time of the survey). Consistent with surveys in the past, a majority (68.7%) of the participants are either from the United States (39.2%) or China (29.5%). The next largest representations are from the United Arab Emirates (UAE, 3.6%), India (3.4%), and Saudi Arabia (3.1%).
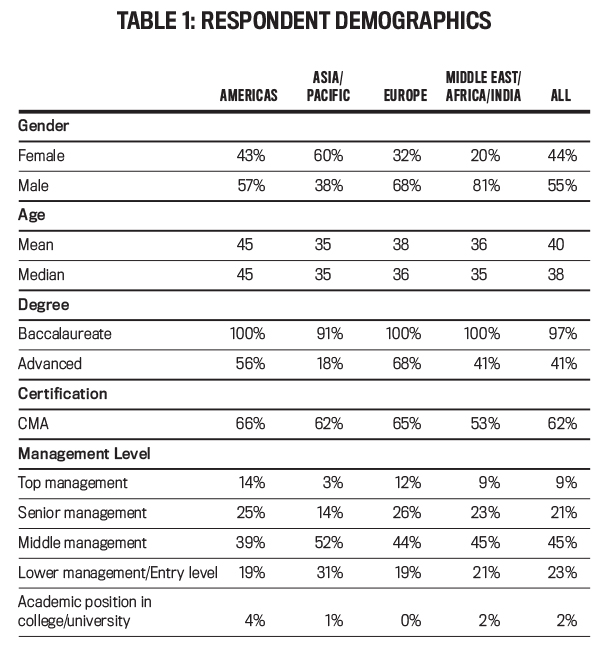
The demographics of the participants are summarized in Table 1 by region: the Americas, Asia/Pacific, Europe, and Middle East/Africa/India (MEAI). Compared to the previous survey, the percentage of female respondents decreased. Overall, 44% of the respondents identified as female (compared to 50% in last year’s survey), 55% identified as male, and 1% preferred not to disclose. Across regions, the percentage of females participating varies, with 43% in the Americas, 60% in Asia/Pacific, 32% in Europe, and 20% in MEAI.
The mean and median ages of the respondents, overall, are 40 and 38 years old, respectively. This is slightly higher compared to last year. Respondents in the Americas are, on average, five years older compared to the overall mean. Asia/Pacific has the youngest average age of any region at 35 years old.
In terms of education, 97% of the participants have at least a bachelor’s degree, with 41% holding a master’s and/or a doctorate degree. Only Asia/Pacific had less than 100% of respondents holding a bachelor’s degree (91%).
Overall, 62% of the respondents hold the CMA®(Certified Management Accountant) certification, which is an increase from 53% last year. Three regions had more than 60% of their respondents holding the CMA: the Americas (66%), Asia/Pacific (62%), and Europe (65%). This is a promising trend, as the percentage of those holding the CMA continues to increase each year. This trend should continue since, based on this year’s survey, 81% of those not currently holding the CMA intend to pursue the certification in the future.
COMPENSATION
Table 2 presents the mean and median annual salary and total compensation by region. The Americas had the highest median salary ($103,000), followed by Europe ($75,000). These results are consistent with last year, which is encouraging and may mean that, at least for the survey participants, the pandemic didn’t significantly affect their compensation. Asia/Pacific and MEAI had the lowest median salary of $22,000 and $25,000, respectively. These results are also consistent with the previous year.
Across all regions, 83% of the participants’ average compensation comes from base salary, indicating that 17% of the total compensation comes from bonuses, overtime, and so forth. This varies little across regions, with 83% of the average compensation coming from base salary in the Americas, 81% in Asia/Pacific, 88% in Europe, and 86% in MEAI.
IMPACT OF COVID-19
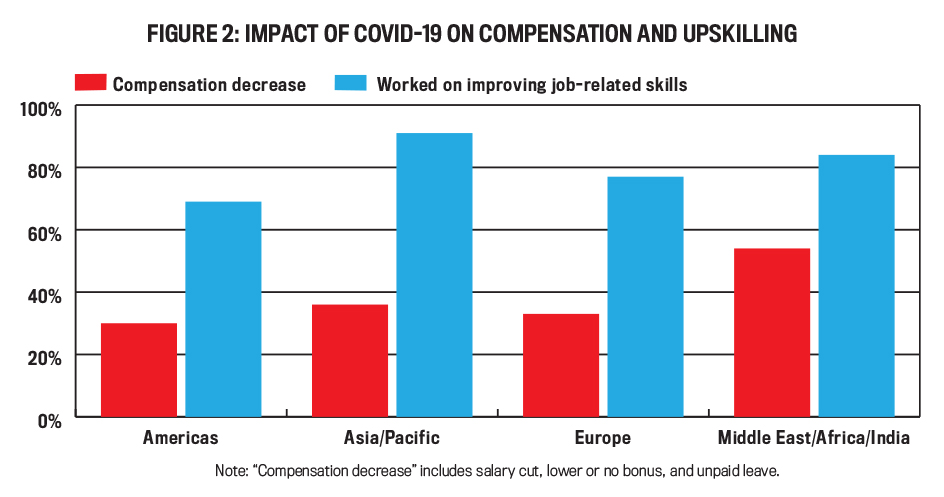
We asked survey participants this year about the impact of COVID-19 on their compensation and other ways it has impacted them. Overall, 64% of respondents said there was either an increase or no change in their compensation during the pandemic. The remaining 36% said they had their salary decreased, received a lower bonus or none at all, or were placed on unpaid leave (furloughed). As shown in Figure 2, MEAI respondents were impacted the most, with 54% indicating a salary decrease or unpaid leave. The Americas and Europe had the lowest percentage of respondents whose total compensation during the pandemic increased or stayed the same (30% and 33%, respectively), and Asia/Pacific was close at 36%.
Those holding the CMA were slightly less likely to experience a salary cut than non-CMAs (35% vs. 38%). Also, those who strongly agreed with the following statements were less likely to have a salary decrease than those who strongly disagreed:
- “My job impacts the strategic direction of the company.” (33% vs. 39%)
- “My total compensation package is very competitive with that of my peers.” (30% vs. 41%)
- “I love my job.” (33% vs. 42%)
These results suggest that those respondents who have strategic impact on their companies, receive commensurate pay, and love their job were better off compensation-wise during the pandemic than those without those skills or influence. There was little, if any, difference in impact on compensation between males and females, management levels, company sizes, or education levels. Respondents’ industries least impacted by COVID-19 were government (12% with a salary decrease) and medical (28%). Respondents’ industries most impacted were public accounting and wholesale and retail trade (both with 41% experiencing a salary decrease), and other services (43%).
Besides compensation, COVID-19 impacted respondents’ jobs in other ways. Seventy-nine percent of all respondents said they have worked on their job-related skills during the pandemic. As shown in Figure 2, Asia/Pacific had the highest percentage of respondents working on their job-related skills (91%), followed by MEAI (84%), Europe (77%), and the Americas (69%). This order roughly corresponds to the order in which the percentage of respondents in these regions experienced decreased compensation during the pandemic.
COVID-19 AND THOSE NOT WORKING FULL-TIME
A total of 165 respondents to this year’s survey aren’t working full-time: 107 are unemployed, 26 are working part-time, 17 are students, and 15 are retired. Of the 107 unemployed respondents, 32% were laid off, 16% were making a career change, and 8% said their company went out of business. Only 4% were on unpaid leave or furloughed. Twenty-six percent of the unemployed respondents said they hadn’t been impacted by COVID-19.
Of the 15 retired respondents, five said they were impacted by COVID-19—four decided to retire and one said the company went out of business. For those working part-time at the time of the survey, 12% said COVID-19 caused them to be furloughed, 8% were laid off, 19% said they are making a career change, 31% are working to improve their skill set, and 73% said they are considering upskilling or reskilling.
CMA CERTIFICATION
Holding the CMA certification signals to current or prospective employers that a person has mastery of a skill set designed to help a company continue to succeed and improve. This skill set is valued by employers, as indicated in Table 3. The median base salary and total compensation for those holding the CMA is significantly higher compared to those who don’t hold the certification. Overall, the difference in median total compensation between CMAs and non-CMAs is $29,000. This means that a CMA earns 58% higher median total compensation compared to a non-CMA.
MEAI had the largest difference between the median total compensation earned by CMAs and non-CMAs (80% greater), followed by Asia/Pacific (35% greater), and the Americas (25% greater). Europe had a relatively low number of respondents for comparison.
These results confirm that the skill set held by CMAs is valued when negotiating compensation. As stated by a corporate controller in the U.S., “The CMA is a certification of my knowledge and has made for easier job hunting and the ability to negotiate a higher salary.” In addition, a senior accountant in Dubai said, “Being a CMA not only helps me negotiate for a higher pay, but also I can see a clearer view of the direction my company is heading and propose better ways to improve.”
Comparing the impact of COVID-19 on CMAs vs. non-CMAs for the 107 unemployed respondents, CMAs were more likely to say their job had not been impacted by COVID-19 than non-CMAs (33% vs. 21%), less likely to be working on improving their skill sets (26% vs. 44%), and less likely to be making a career change due to COVID-19 (9% vs. 21%).
The results suggest that CMAs overall were less impacted by the pandemic and more likely to feel they have adequate skill sets to get by than non-CMAs. For example, a non-CMA respondent who was furloughed commented she is doing her best to “exploit the long time that I have spent at home because of the current pandemic of COVID-19 to study and take Part 2 of the CMA exam.” Another unemployed non-CMA pursuing a career change cited the problem: “How [does one] cope with stress in this pandemic when jobs are limited?”
The average age of those holding the CMA is approximately 41 years old, which is three years older compared to those not holding the certification. Across age groups and regions, there’s a higher percentage of those 50 and older who hold the CMA in Asia/Pacific and the Americas (85% and 71%, respectively).
Those in lower management who hold the CMA earn 90% more in median base salary compared to non-CMAs at the same level. This is the largest difference in terms of management levels and certification. Those in senior management had the smallest difference between the median base salary of CMAs vs. non-CMAs (CMAs earn 13% more compared to non-CMAs). Those in top management who hold a CMA earn 64% more in median base salary compared to non-CMAs at the same level. In addition, those holding the CMA are more likely to hold specific job titles compared to non-CMAs. A higher percentage of CMAs are directors (73%), CFOs (72%), and finance managers (66%).
The value of the CMA certification translates beyond the additional earning power. This value is evident from the following comments made by those holding the CMA:
- “The CMA has improved overall competencies including professional expertise, analytical skills, and management skills. I’m able to address problems from a higher-level perspective.”—a finance manager in China
- “The CMA certification has been a game changer to my career. It has not only boosted my competence level and skills but has also given me the confidence to give my input to management on the finance side whenever required.”—a senior accountant in Qatar
- “The CMA certification has broadened my knowledge base into areas not directly related to my field but gives me the ability to transcend the barriers to other financial management areas and contribute intelligently to the overall success of the organization.”—a financial analyst from the U.S.
- “CMA certification makes my career boom from being plain and simple to fascinating and exciting. It helps me to empower my clients/company to scale their business to the next level.”—an accountant in top management in the Philippines
- “The CMA gave me a boost of confidence. I am part of the committee that gives financial advice to the chairman. The CMA helped me in getting heard—being the only woman on the committee, most of the time I was disregarded. The CMA has changed that.”—a chief accountant in Beirut
Figure 3 illustrates the differences in median total compensation for respondents in the U.S. who hold the CMA, the CPA (Certified Public Accountant), or both, compared to U.S. respondents who hold neither certification. Overall, those holding either or both certifications earn a higher median total compensation. Those holding only the CMA earn 59% higher median total compensation compared to those without either the CMA or the CPA. Those holding only the CPA earn 106% higher median total compensation compared to those with neither certification. Those holding both the CMA and the CPA earn 149% higher median total compensation compared to those without either certification.

These results show the value placed on the specific skill sets of each certification. In fact, the value of having both certifications, and thus two different skill sets, is reflected in the much higher median total compensation earned by those with both certifications. These results hold across all age groups, with those participants ages 20 to 29 holding both certifications earning 218% higher median total compensation than those without. This provides strong evidence and motivation for students considering both certifications simultaneously as they complete their degree.
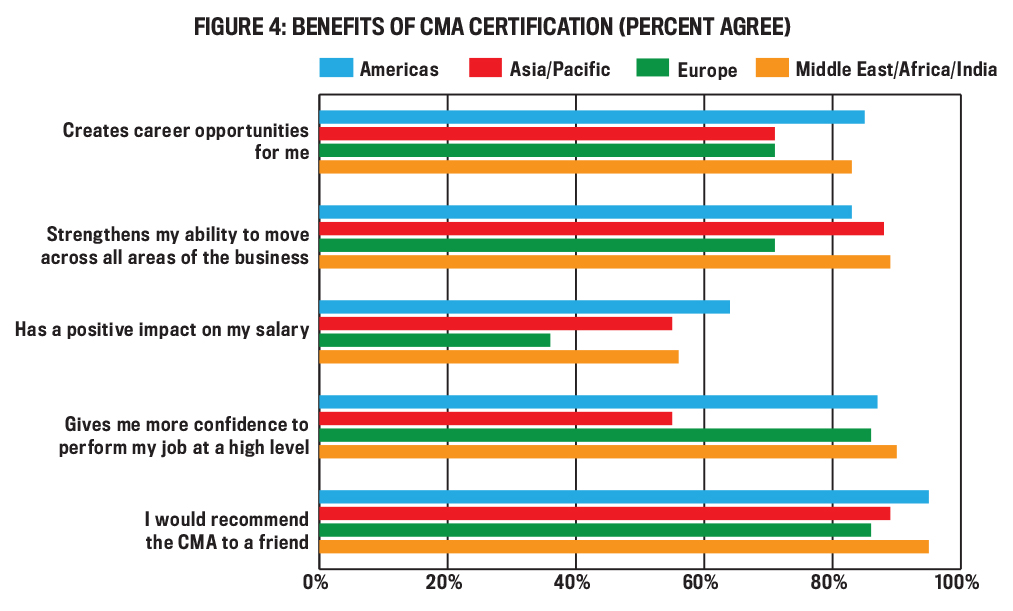
Figure 4 shows that the CMA provides other benefits beyond higher salary and compensation. For those holding the CMA in the Americas, Europe, and MEAI, high numbers of respondents agreed that the certification gave them more confidence to perform their job at a high level (87%, 86%, and 90%, respectively). Respondents in Asia/Pacific agreed most often that the CMA strengthens their ability to move across all areas of the business (88%).
Those in the Americas were more likely to agree that the CMA creates career opportunities (85%) and has a positive impact on their salary (64%). Participants in MEAI were more likely to agree, compared to those in other regions, that the CMA gives them more confidence to perform their job at a high level (90%) and the ability to move across all areas of the business (89%).
In addition, almost 93% of all CMAs said they would recommend the CMA to a friend. Ninety-five percent of participants in the Americas and MEAI agreed with this statement.
Seventy-nine percent of those holding the CMA agree that career advancement is also a benefit to holding the CMA. This benefit was consistently mentioned in the survey comments:
- “The CMA certification has enhanced the way of strategic thinking in taking business decisions and professional accounting knowledge. This professional certification further enables a pathway for the next level in my career growth.”—a finance manager in India
- “Within a year of attaining the CMA certification, I have been promoted to a role significantly higher than the one I was performing previously. Part of the reasoning behind management’s decision was my CMA certification.”—a corporate controller in Oman
- “The CMA has provided me with a wider range of knowledge and an edge in my career.”—a cost accountant in China
- “The CMA certification improved my soft skills, IFRS [International Financial Reporting Standards], strategic management, and many other skills, therefore increasing my competence and confidence. My company’s view of my skills is also very much improved. This year, I am listed in the vertical potential pool, which means I will get a promotion in two years.”—a director in Turkey
- “The CMA helped me prove my professional competence and gave insights into the latest updates in the profession and more career opportunities.”—a senior accountant in China
- “I would not have my current job without my CMA and would certainly not have the salary that I currently have. My CMA has increased my salary significantly and opened up a lot of doors.”—a plant controller in the U.S.
MANAGEMENT LEVEL
Figure 5 presents the median total compensation by management level and region. The median total compensation increases at each management level for every region except Asia/Pacific and Europe, where the median is slightly lower for those in top management than for those in senior management.
The Americas have the most consistent increases in median total compensation at each management level, with those in middle management earning 43% more than those in lower management, senior management earning 26% more than those in middle management, and top management earning 23% more than those in senior management.
INDUSTRY REPRESENTATION AND COMPENSATION
Respondents are employed by many different types of businesses. Manufacturing had the highest percentage of representation (24.0%), followed by finance (12.1%) and wholesale and retail trade (8.6%). A higher percentage of participants are employed by companies with 5,000 or more employees (27.2%), compared to companies of other sizes. The next highest percentage of respondents are employed by companies with a total number of 100 to 499 employees (22.9%).
Across regions, the industries with the highest median total compensation vary. In the Americas, the agriculture/forestry industry has the highest median total compensation ($143,502), followed by other services ($130,000), finance ($123,000), and wholesale and retail trade ($123,000). For Asia/Pacific, those in the medical industry earn the highest median total compensation ($38,000), followed by finance ($37,658). Participants in wholesale and retail trade earn the highest median total compensation in Europe ($112,850), followed by manufacturing ($108,500). Respondents in the agriculture/forestry industry earn the highest median total compensation in MEAI ($50,000), followed by education ($45,000).
JOB SATISFACTION
Table 4 presents the percentage of respondents either somewhat agreeing or strongly agreeing to certain statements related to their jobs. Overall, 65% of the respondents agreed that their job impacts the strategic direction of the company. Across regions, those in the Americas had the highest rate of agreement (74%), followed by MEAI (68%), Europe (67%), and Asia/Pacific (50%).
Respondents were also asked whether they agreed that their compensation package was competitive with their peers. The Americas had the highest percentage agreeing with this statement (62%), followed by Europe (56%), MEAI (42%), and Asia/Pacific (32%).
Of the total participants, 71% agreed with the statement “I love my job.” Across regions, a higher percentage of respondents holding the CMA agreed with this statement compared to non-CMAs in Asia/Pacific (72% vs. 67%), Europe (70% vs. 56%), and MEAI (70% vs. 67%). The percentage agreeing for CMAs and non-CMAs was equal in the Americas (73%). Therefore, for all regions, the percentage of respondents satisfied with their jobs was greater than or equal to their satisfaction with their compensation. This indicates that there are other intrinsic rewards associated with their jobs that aren’t represented by being compensated. These rewards may include things such as a flexible work schedule, free lunches, or a sense of community among coworkers.
ADDITIONAL COMPENSATION
Overall, 72% of the respondents received some type of additional compensation, such as bonuses, profit sharing, and overtime pay. Of those receiving additional compensation, 62% received a bonus, 12% received profit sharing, and 9% received overtime pay. Across regions, Europe had the highest percentage of respondents receiving some form of additional compensation (78%), with MEAI having the lowest percentage (60%). The Americas had the highest median additional compensation ($12,000), while MEAI had the lowest ($2,000).
HOURS WORKED
Table 5 presents the average hours worked in a week by region and select countries. The average workweek for all participants was 45 hours. This is an increase from last year when the average workweek was 43.4 hours. The increase in hours may be attributed in part to fewer employees performing the same amount of work due to layoffs triggered by the pandemic. The Americas had the longest workweek (46.1 hours), while Asia/Pacific had the shortest (43.7 hours).

A YEAR OF TURMOIL
No one could have predicted how much the year 2020 would change our lives and our economic landscape. Yet our survey respondents continue to carry on—even indicating strong trends in compensation and certification. Amid all the uncertainty, respondents appear satisfied with their jobs, with more than seven out of 10 agreeing with the statement “I love my job.”
Holding the CMA certification continues to add value in terms of compensation and other benefits. Those holding the CMA earn compensation that is generally much higher compared to those not holding the certification. For those holding the CMA, 88% agreed that it gave them confidence to perform their job at a high level and 85% agreed that it strengthens their ability to move across all areas of the business.
We would like to thank all those who responded to this year’s survey. We’re grateful for your continued support.
March 2021


