DATA TYPES
The WolframAlpha data is found on the Data tab, beneath the existing Stocks and Geography data types. Although the gallery offers Chemistry, Element, Space, Satellite, Movie, Food, Activity, University, Location, and ZIP Code data types, there are dozens more available under the Automatic category.
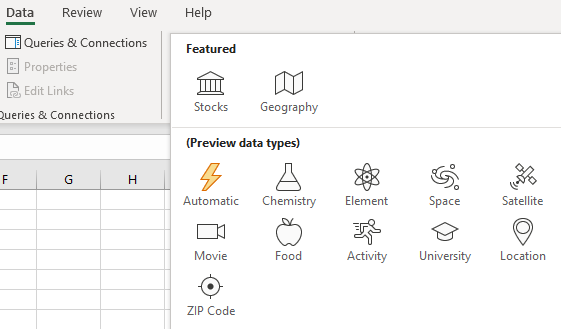
To accommodate the rich data, Excel improved the data types. A single formula can now return an array of values. If you ask for historical monthly weather, you’ll automatically receive 12 rows of answer. Ask for weekly or daily data, and Excel will populate 53 or 366 cells. While the old Geography data type might have offered 12 fields for each city, the new Location data type offers hundreds of data fields including population statistics by age, gender, race, education level, and household income.
USING THE DATA TYPES
To get started, you need a Home or Student edition of Microsoft 365. On the File, Account tab, opt into the Office Insiders program, choose the Beta level, and then restart Excel twice.
Type one or more cities in a column. Select the cities and choose Data, Data Types, Location. WolframAlpha will convert the cells to a rich data type and add an icon with two buildings. If your original data said “Columbus, Indiana,” then the conversion will happen quickly. But if your cell says “Columbus,” you’ll have to use a Data Selector panel to specify which Columbus you mean.
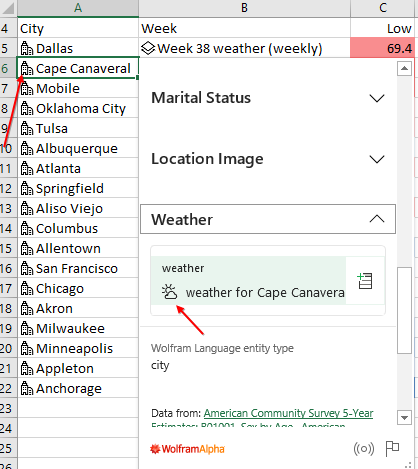
Once the cells are converted to a data type, click on the Buildings icon for one cell. An improved data card appears that lets you browse the knowledge base. Scroll down to the Weather section. You’ll see an icon of a sun and cloud icon to the left of “weather for city.” At first glance, this looks like a useless decorative element. When you click the icon, however, you’re drilling down into the WolframAlpha knowledge base.
RETRIEVING DATA WITH FORMULAS
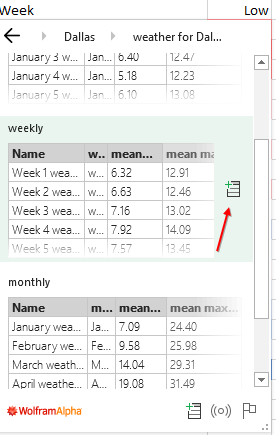
After clicking the weather icon, you’ll arrive at a new panel offering historical weather data. Click the weather icon to drill down again. The next screen shows you a preview of monthly, weekly, or daily historical data. Hover over any section, and an “add to grid” icon appears. Click the icon and Excel will build formulas in the grid.
Start with a single city in cell A5. Add weekly weather. You’ll get 53 results starting in B5 and extending to B57. A single formula in B5 generates all 53 results: =A5.weather.history.weekly.
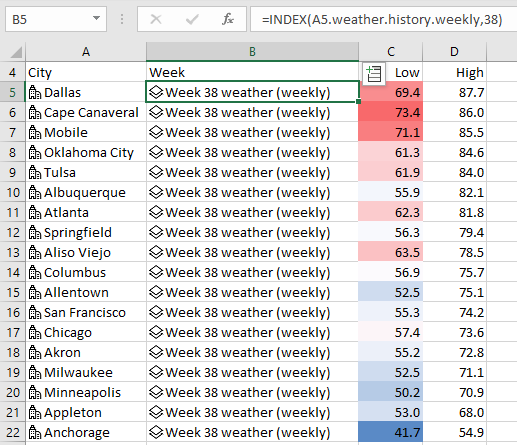
Let’s say you’re planning a mid-September promotion for a chain of retail stores. You need to figure out if you should promote fall jackets or send the summer clearance items to each store. September 15 falls during Week 38. To limit the weather data to Week 38, you would use the INDEX function: =INDEX(A5.weather.history.weekly,38).
Note that the formula result in B5 has a new icon that resembles a stack of paper. Although B5 says “Week 38 weather (weekly),” this cell contains the weather information for Dallas, Texas. In cell C5, use a formula of =B5.[mean low temperature]. Because WolframAlpha is a scientific knowledge base, the answers are in Celsius. To convert to Fahrenheit, use =CONVERT(B5.[mean low temperature],“C”,“F”). A similar formula in D5 provides the mean high temperature. The image below shows the average weekly temperature for each store location. Several stores will be experiencing low temperatures in the 50s and seem perfect for the fall jacket promotion. Several other stores still have high temperatures in the 80s and can likely use the summer clearance items from the colder-weather stores.
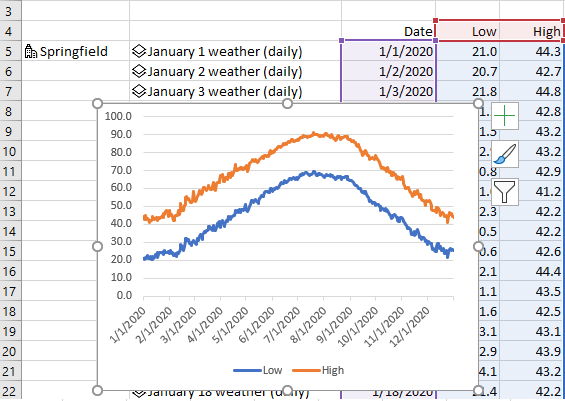
Now consider another weather example. This time, Excel pulls daily high and low mean temperature for a single city: Springfield, Mo. The Springfield rich data type is in A5. A formula of =A5.weather.history.daily in cell B5 generates 366 rows of data. The dates in column C come from =DATEVALUE(B5#.Date). (The # in that formula is the array operator.)
Since B5 is returning 366 cells, then the formula in C5 will also return 366 cells. Oddly, the CONVERT function needed in columns D and E to convert from Celsius to Fahrenheit won’t accept the B5# notation. You’ll have to display the Celsius temperatures in a hidden column, then use 366 rows of CONVERT functions to generate Fahrenheit.
Weather is a small portion of the new data available. For example, the demographic information would allow you to find the percentage of households in a city with income of $200,000 and higher. There are plenty of uses at home, from tracking calorie intake based on foods to calorie burn based on yoga poses. You can retrieve a list of actors from a movie or a list of movies from an actor.
SF SAYS
Microsoft is slowly rolling out the new data to home and student customers first. It will come to enterprise editions later this fall.

September 2020


