How does the economic outlook impact job security and compensation? IMA® (Institute of Management Accountants) conducts an annual survey to determine how its global members are faring during these tumultuous times. The survey provides an opportunity to analyze important trends in compensation and other factors affecting employment and careers.

80 COUNTRIES
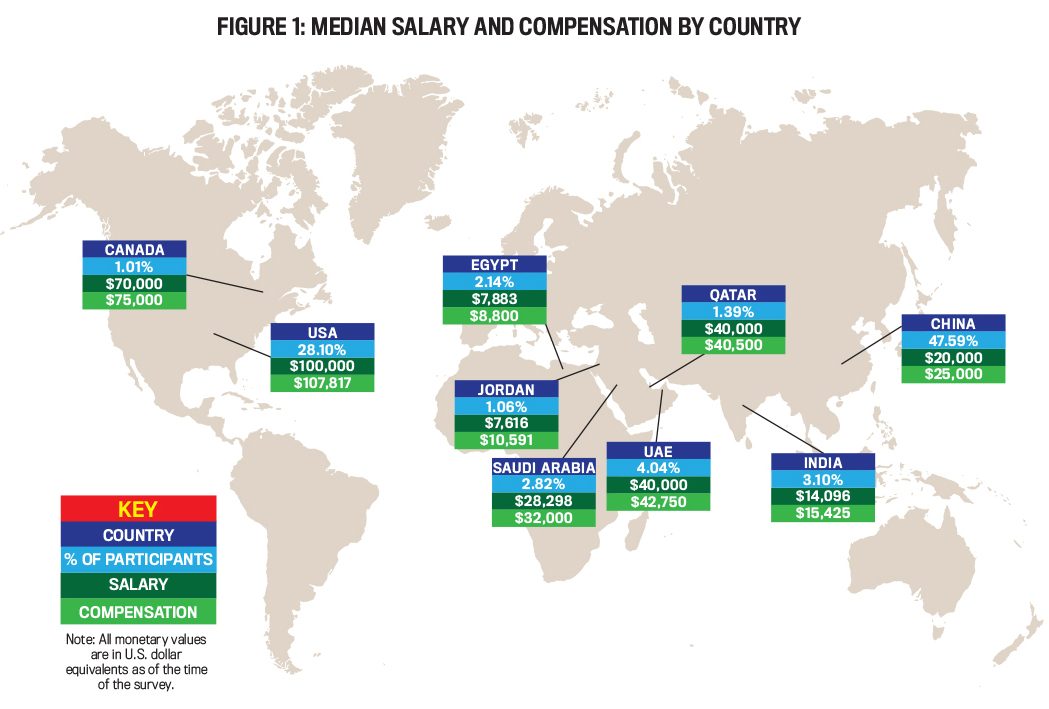
This year’s survey includes 4,253 responses from 80 different countries, which speaks to IMA’s global presence. Figure 1 presents the median salary and total compensation for all countries with at least 1% of the survey respondents. (All monetary values are in U.S. dollar equivalents as of the time of the survey.) The percentage of respondents from China continues to grow, outpacing the respondents from the U.S. for the first time. Last year, U.S. respondents represented approximately 31.4% of the total respondents, while China represented 30.2%. This year, 47.6% of the respondents are from China and 28.1% are from the U.S. The third largest representation is from the United Arab Emirates (4%).
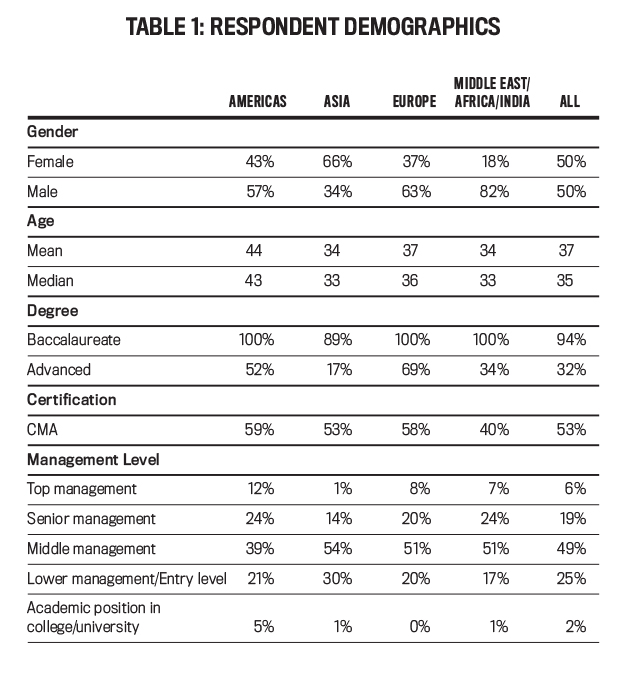
Click to enlargeTable 1 summarizes select demographic information for each region: the Americas, Asia, Europe, and Middle East/Africa/India (MEAI). Note: In previous years, India was included in the Asia region. It is now included with the Middle East and Africa to align more closely with IMA operations. In recent years, the overall percentage of female respondents has been steadily increasing (37% and 40% in the 2018 and 2019 reports, respectively). This year is no exception, with women making up 50% of the respondents. This is very encouraging, especially given the significant increase in international respondents. The Americas region experienced a decrease in the percentage of female respondents (2%), while the MEAI region experienced the highest percentage increase (4%). Consistent with prior years, the Asia region was the only one with more female respondents (66%).
Overall, the mean and median age of the respondents is 37 and 35, respectively, which is the same as last year. Across regions, respondents are slightly older, on average, compared to last year. Only the Europe region had any significant change in the average age of respondents, increasing by 1.8 years to 37. Respondents in the Americas region (primarily the U.S.) continue to be older (44) compared to all other regions (ranging from 34 to 37). The Asia and MEAI regions have the youngest respondents, with an average age of 34. Compared to previous years, there’s no significant shift between age groups within each region. The largest shift occurred in the Europe region, where the percentage of those in their 20s decreased by 8.7% and the percentage of those in their 40s increased by 9.5%.
The overall percentage of respondents holding the CMA® (Certified Management Accountant) certification increased significantly to 53% this year, compared to 37% last year. The Americas region has the highest percentage holding the certification (59%), followed closely by respondents in the Europe region (58%). The Asia region had the largest increase in the percentage (20%) holding the certification to 53%. The increase in the percentage of respondents holding the CMA is exciting and consistent with last year’s survey results, where 85% of those not holding the CMA intended to earn the certification in the future.
COMPENSATION
The mean and median annual salary and total compensation by region are presented in Table 2. These results vary slightly across regions, with the Asia region being the only one to have a decrease in both mean and median annual salary and total compensation. The Americas, Europe, and MEAI regions all had increases in average and median compensation. The Americas region had the highest median total compensation ($103,500), followed by Europe ($71,500), and both the Asia and MEAI regions ($25,000). The biggest increase in median total compensation was in the MEAI region, which had an increase of 32% compared to last year.

Click to enlarge
The small decrease in compensation in the Asia region is primarily due to a higher mix of early-career women among this year’s respondents. This is exciting news as it suggests that Chinese women in entry-level jobs are looking to improve their future by becoming IMA members and pursuing the CMA credential.
The difference between base salary and total compensation also varies by region. The Americas and Europe regions have the highest percentage of compensation coming from base salary (92%), where additional compensation, such as bonuses and overtime, may not be as prevalent as in the Asia region, where only 80% of the average total compensation is in the form of a base salary.
Please be aware that the results represent the survey respondents and don’t necessarily reflect the whole population of finance professionals. Readers should be cautious about making comparisons of their salary to global, regional, or even same country results as they’re highly affected by the demographics of the respondents.
GENDER PAY DIFFERENCES
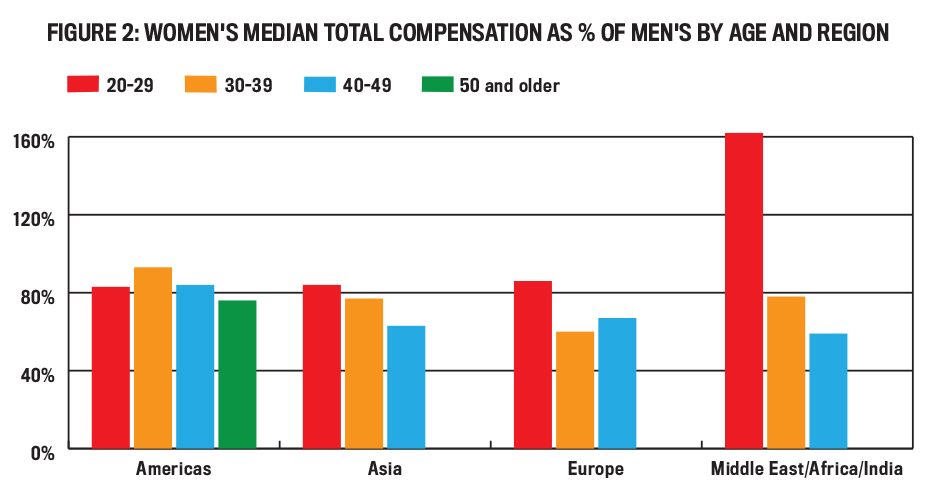
Figure 2 summarizes the gender salary gap by region and age group. Overall, the Americas region held steady with a total salary gap for median total compensation of 86%. The MEAI region had the largest increase in the reported salary gap from last year, going from 95% in 2018 to 73% in 2019. The salary gaps for median total compensation in the Asia and Europe regions increased slightly by 3% and 7%, respectively.
Click to enlarge
Only one age group, respondents ages 20 to 29 in the MEAI region, had women’s median total compensation as being higher than men’s (62% higher). Incidentally, this same region also had the highest salary gap for all regions, 59% for those ages 40 to 49.
CMA CERTIFICATION
The CMA certification validates a skill set that signals to current and future employers that those holding the certification will be valuable in helping an organization succeed. Table 3 shows the median salary and total compensation by region and CMA certification, indicating significantly higher salaries for CMAs vs. non-CMAs. Overall, CMAs earn a median salary that’s 60% greater than non-CMAs and a median total compensation that’s 63% higher. This is particularly interesting given that 51% of CMAs in this year’s survey received their certification within the last two years, meaning they have only just begun to experience the added impact of having a certification.
Click to enlargeThe difference in median salary and compensation between CMAs and non-CMAs has decreased compared to last year (when it was 117% and 118%, respectively), but those results were unusually high, driven by several shifts in the demographics of the respondents—including a significant number of non-CMAs in their 20s with much lower salaries compared to CMAs. Comparing this year’s results to the 2018 report in which CMAs had 62% higher median salary and 67% higher median total compensation than non-CMAs is more meaningful.
The earning power of the CMA is consistent across regions, with the median salary and total compensation higher for CMAs vs. non-CMAs for every region. The MEAI region has the largest difference between CMAs and non-CMAs in both median salary (102%) and median total compensation (92%), which is consistent with prior years. In the Americas region, CMAs earn a median salary and total compensation that’s 31% and 32%, respectively, higher than non-CMAs. This is also consistent with prior years. In the Asia and Europe regions, CMAs earn a median salary that’s 29% and 32% higher, respectively, compared to non-CMAs.
Based on these results, employers continue to place a high value on the set of skills represented by the CMA certification. Respondents consistently commented on how their skills as a CMA positively affected their job performance. For example, a treasury analyst from Saudi Arabia stated, “The CMA gives you immense knowledge and a foundation to thrive as a finance professional. [The CMA] also enables you to understand various aspects and roles of finance and accounting in a business. As a CMA, I learned to deal with complex real-life financial decisions in the workplace, as well as how to interpret numbers to formulate a plan of action.”
Across all management levels, those holding the CMA earn a higher median salary and total compensation compared to those without the certification. Besides those in academia, the largest difference between the median salary and total compensation exists for those in senior management (51% and 58%, respectively). This result is largely driven by younger respondents holding the CMA in senior management positions. For those ages 20 to 29 holding the CMA and in senior management positions, the median salary and total compensation is 100% and 107% higher, respectively, compared to those in the same age group and management level without the certification. This is evidence that the CMA opens doors to upper management and higher compensation in the early stages of one’s professional career.
Further, the majority of those in top management and senior management are CMAs (62% and 61%, respectively). More specifically, the following job titles were more likely to be filled by CMAs than non-CMAs: CFO (67%), controller (59%), director of financial planning and analysis (63%), and senior financial analyst (66%).
The average age of those holding the CMA is 38, almost three years older than those without the certification. Overall, the average number of years the respondents have held the CMA is almost seven, with those in top management holding the certification for more than 14 years on average.
Eighty-seven percent of non-CMAs in the survey said they intend to pursue the certification in the future, indicating that the value of the certification is well known. As in previous years, the value of the CMA is recognized by respondents in their comments. A vice president from Pennsylvania said, “The greatest value is self-fulfillment and satisfaction in knowing that I have achieved a certification that sets me apart in my profession and to which I maintain a high standard of excellence.” And a financial reporting manager from Dubai said, “The value of the CMA is more than expected. After completing the CMA, there is a globally renowned certification attached to my name. My skills are enhanced, and people have started recognizing me.”
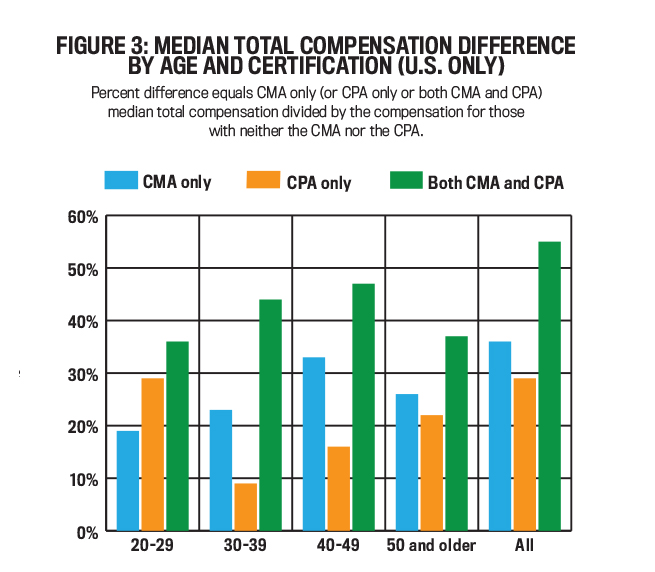
The differences in median total compensation for respondents in the U.S. who hold the CMA, the CPA (Certified Public Accountant), or both compared to U.S. respondents holding neither are compared in Figure 3. Overall, those holding either the CMA, CPA, or both earn a higher median total compensation compared to those holding neither the CMA nor CPA. Those holding only the CMA earn 36% higher median total compensation, while those holding only the CPA earn 29% higher median total compensation. Those holding both certifications earn 55% higher median total compensation.
Click to enlargeThe fact that holding both certifications increases earning power compared to holding just one of them strengthens the argument that the CMA and the CPA validate different skill sets. Employers continue to attach value to the breadth of knowledge and skills obtained by both certifications. This result holds across all age groups. Those ages 40 to 49 holding both certifications earn 47% higher median total compensation compared to those not holding either certification.
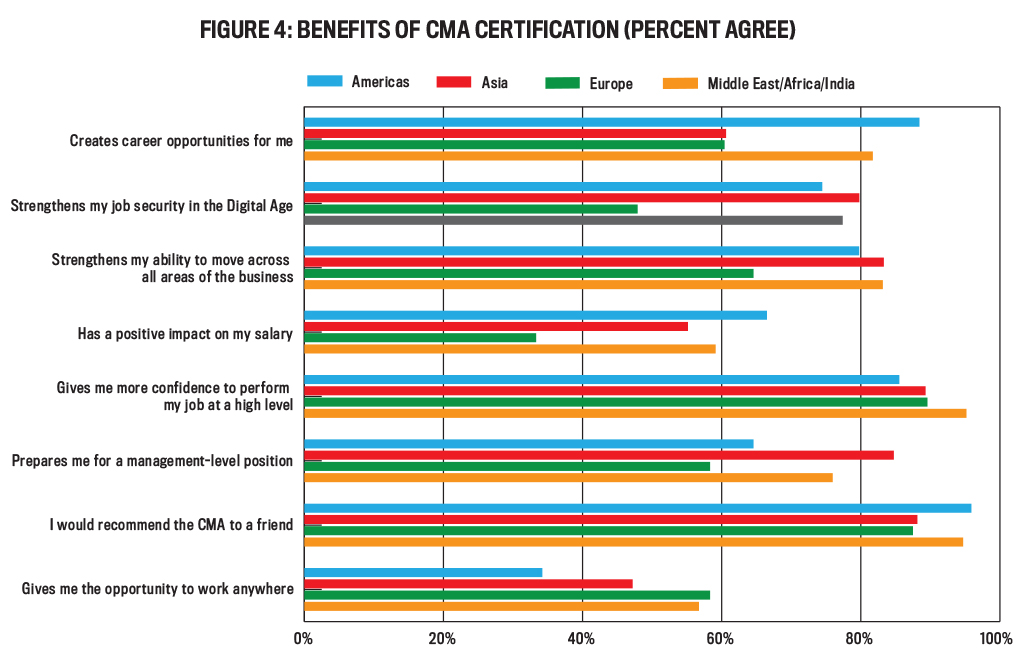
The CMA provides other benefits beyond salary and compensation (see Figure 4). About 90% of all respondents holding the CMA stated the certification gave them more confidence to perform their job at a high level. This benefit had the highest percentage of agreement for those in the MEAI region (95%). Further, more than 90% of all CMAs said they would recommend the CMA to a friend.
Click to enlargeMore than 70% of the respondents agree that the certification provides career opportunities for them. In fact, even for respondents who intend to pursue the CMA in the future, 76% of those respondents cited career advancement as the primary reason for gaining the certification. “The CMA helped open doors for me in terms of promotions and opportunities for advancement. Being a globally recognized credential that signifies a higher-level talent, it has served as a point of differentiation as I continue to grow my career,” a controller from Michigan said. A senior financial analyst from Lebanon said, “The CMA has widened my knowledge in the finance and accounting fields and has opened a lot of doors for me.”
MANAGEMENT LEVEL
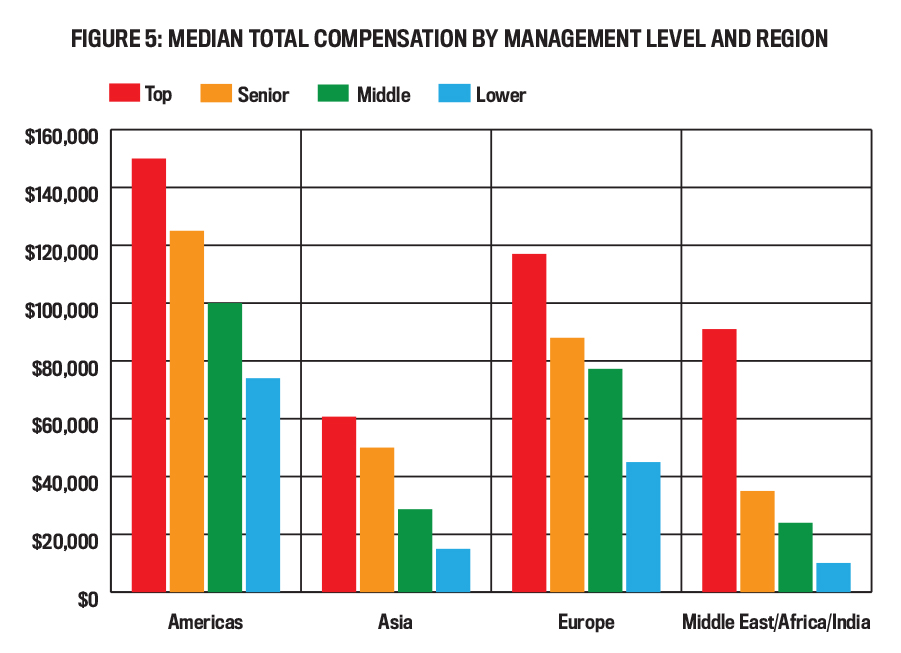
Figure 5 presents the median total compensation by management level and region. The compensation difference between management levels varies by region. In the Americas region, the median total compensation increases steadily by 35% from lower level to middle management, 25% from middle management to senior management, and 20% from senior management to top management. The increases are also significant for the other regions.
Click to enlargeORGANIZATIONAL CHARACTERISTICS
The highest percentage of respondents are employed in the manufacturing industry (23.7%), with finance (12.5%) and wholesale and retail trade (8.7%) coming in second and third, respectively. All sizes of organizations are represented equally, with 24.2% of the respondents from organizations made up of 1 to 99 people, 25.7% coming from companies with 100 to 499 people, 27.3% coming from companies with 500 to 4,999 people, and 22.7% coming from organizations of more than 5,000 people.
The respondents were asked what their organization struggles with the most. The most frequent responses were talent management (26.8%); planning, budgeting, and forecasting (24.9%); and internal controls (22.8%). Across regions, talent management was most concerning for the Americas, Europe, and MEAI regions. The biggest concern noted by respondents in Asia was internal controls (27.6%).
The results vary somewhat across industries, with those in agriculture, education, finance, government, public accounting, and other services listing talent management as their primary concern. Those in agriculture, contract construction, medical/health services, and wholesale and retail trade listed planning, budgeting, and forecasting as a primary concern. Cost management was the biggest concern for those in manufacturing and transportation, communications, and utility services, while decision analysis was the main concern for information technology companies.
JOB SATISFACTION
Table 4 summarizes the percentage of respondents who somewhat or strongly agree with certain job characteristics and salary and job satisfaction. Almost 80% of the respondents agree that they have appropriate information systems to perform their job effectively, and this result is consistent across regions. In addition, the majority of the respondents agreed that their job impacts the strategic direction of the company.
Click to enlargeSeventy-six percent of respondents somewhat or strongly agree that they love their jobs, which is virtually unchanged from last year (77%). The Asia region had the highest percentage of respondents agreeing with this statement (79%), while the Americas and Europe regions had the lowest (74%).
Job satisfaction remained steady even though less than half of the respondents globally agree that their salary is competitive with their peers. This indicates that there are intrinsic rewards, such as a sense of achievement, recognition, taking pride in one’s work, and autonomy, that can compensate for a less competitive salary. There are nonmonetary rewards being gained as well, such as health insurance, retirement benefits, and others. The Asia region has the biggest difference between job satisfaction and satisfaction with salary (50%), and the Americas region has the smallest difference (13%).
Job satisfaction is very subjective and is based on everyone’s unique needs and talents. Other factors that may affect job satisfaction include the opportunity for pay raises, forms of additional compensation, and hours worked.
Raises
Overall, 57% of the respondents received a raise within the last year. The highest percentage of respondents receiving raises was in the Americas region (67%), followed by the Europe region (57%), the Asia region (54%), and the MEAI region (48%). The median raise was 10% for the Asia, Europe, and MEAI regions. The median raise was lowest in the Americas region (4.4%).
Additional Compensation
Based on the survey results, overall, respondents received 16% of their median salary in the form of additional compensation, which includes bonuses, profit sharing, overtime pay, and other forms of additional compensation. Consistent with the prior year, the Asia region had the highest percentage of median total compensation coming from forms other than base salary (20% this year vs. 18% last year). Europe had the lowest percentage of median additional compensation (8%).
Globally, 95% of the respondents received one or more forms of additional compensation, with the highest percentage of respondents receiving bonuses (62%), followed by overtime pay (13%) and profit sharing (11%). Twenty-seven percent of the respondents didn’t receive any additional compensation.
Hours Worked
Globally, respondents worked an average of 43.4 hours per week this year, which is almost an hour less than last year (see Table 5). The U.S. consistently has the longest workweek (46.1 hours per week for the second year in a row). India has the second-longest workweek at 45.7 hours and is the only country that had an increase in its average workweek (an increase of 1.2 hours).
Click to enlargeREASON FOR OPTIMISM
Although the economic outlook hangs in the balance, the results of this year’s salary survey provide a ray of optimism for IMA members. The global reach of the CMA continues to grow as evidenced by the large international response to the survey. For the first time, respondents from China outnumbered the respondents from the U.S. And it’s exciting to see so many early-career Chinese women pursuing the CMA credential to improve their future and further contribute to their country.
The percentage of total respondents holding the CMA increased 16% this year. This isn’t surprising given that 85% of non-CMA respondents in last year’s survey indicated that they would be pursuing the CMA in the future. The value of the CMA is consistently validated each year, with CMAs earning a median total compensation that’s between 32% and 92% higher than non-CMAs (depending on region). More than 90% would recommend the CMA to a friend.
Overall, respondents remain satisfied in their careers, with 76% of the total respondents agreeing that they love their job. This is significant given the uncertainty surrounding the world economy, and it provides further evidence that the CMA is a certification that will continue to stand the test of time.
We would like to thank all those who responded to this year’s survey. We’re grateful for your continued support.
March 2020


