

At the same time, faced with increasing concerns over pollution and crude oil supplies becoming less stable and more difficult to extract, many governments have implemented concerted efforts toward incentivizing the generation of renewable sources of energy.
With transportation and shipping accounting for nearly 50% of global energy consumption, according to the International Energy Agency’s World Energy Outlook 2018, it’s imperative to discover cheaper and cleaner methods of transportation to keep our economies and societies growing.
Of the more than 2 million electric vehicles sold globally in 2018, 1.2 million were sold in China, which surpassed the U.S. in 2016 as the largest EV market in the world. With major media outlets such as Bloomberg forecasting the global EV market to exceed more than 10 million EVs sold per year by 2025 and more than 50 million sold per year by 2040, many see China as a key market for decades to come.
Yet with this growth come disruption and upheaval. Moving away from traditional internal combustion engines, among other factors, will lead to a number of new problems and decisions for automotive-related companies, the Chinese government, investors, and consumers. Management accounting methods can be used to help navigate these uncertain waters and address specific management questions. Let’s take a look at some of these questions and examine how management accounting can help answer them.
THE GROWTH OF THE MARKET
While the cost of labor and materials may be lower and manufacturing and safety standards less strict in China compared to the U.S., the biggest reasons for the fast growth of EV sales in China are probably the subsidies and incentives the Chinese government is using to push the market forward. These incentives have caused hundreds of domestic companies to join the EV rush, with more than 500 EV companies now competing in China.
Yet the subsidies have been in decline since 2013. In 2019, China announced that the majority of these direct government subsidies would end by 2020. For companies competing in the market, that led to a significant change. So how can these companies determine the degree to which these subsidies have impacted the huge increase in EV sales?
Here’s how management accounting tools can help answer this question:
- Companies should identify and follow key leading industry metrics that tend to be good predictors of different types of car sales. In this case, given the magnitude of their influence, we would focus closely on the impact of EV sales mix and government subsidies. Other metrics to consider include EV sales units and backlogs (China and global), the cost of batteries, oil prices, and so on.
- Graphical and regression analysis can help find connections among the metrics. Plot EV sales units against potential key performance indicators (KPIs), such as average subsidies and incentives per EV by month, total cost of ownership per EV, and so on.
THE SUCCESS OF BYD
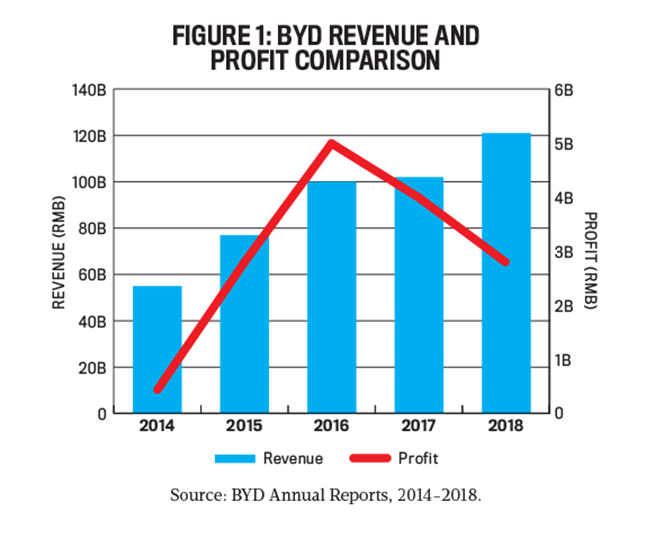
BYD is the leading EV manufacturer in China and trails only Tesla globally. BYD began in 2002 as a manufacturer of battery and gas-fueled vehicles but evolved over time into a producer of EVs and other battery-related products, such as rechargeable batteries, solar panels, handset and assembly services, and commercial vehicles. In recent years, however, the majority of its revenue and profits have come from its automotive and related divisions (59% in 2018).
Figure 1 shows BYD’s revenue and profit comparison from 2014 through 2018. In the first quarter of 2019, BYD made headlines when, as its EV-making peers such as Tesla were reporting substantial losses, it managed to increase its net income by six times to reach $111 million. So how did BYD become so profitable when Tesla couldn’t make a profit?
Here’s how management accounting tools can help answer this question:
- Identify revenue and cost drivers and analyze BYD’s activity and volume over the relevant period. In this case, government subsidies are a key revenue driver.
- Perform a sales mix variance analysis on the different types of products sold by BYD to identify the impact on income due to sales mix, sales volume, sales price, cost of inputs, and quantity of inputs.
- Use data visualization to highlight sales and profits for different products over time. Figures 2 and 3 illustrate BYD’s profitability by major product segment and EV sales mix for the years 2013 through 2018, respectively. BYD produces not only battery electric vehicles (BEVs) but also plug-in hybrid electric vehicles (PHEV), gas-powered cars, and even battery-powered buses and trucks. Yet its primary revenue still lies in the production of passenger vehicles, which consist of both BEVs and PHEVs. BYD’s profitability peaked in 2016 and has been declining the past three years, although profits for its mobile handset components and assembly service have generally been increasing. Meanwhile, unit sales for both BEVs and PHEVs have been increasing steadily.


DETERMINING PRODUCT MIX
PHEVs are a somewhat more mature technological concept compared to BEVs. Utilizing a motor powered by both gas and electric, a PHEV can mitigate many of the deficiencies of a motor vehicle powered solely by electric or gas, such as limited range and long charging times for a BEV and pollution emission for a gas-powered vehicle.
Bucking a trend, BYD’s BEV sales eclipsed its PHEV sales in 2017, only to swing back in favor of PHEVs by a significant margin in 2018. Why? Perhaps because PHEVs utilize fossil fuels yet still receive subsidies as electric vehicles (though less than BEVs), making their production a bargain for both the manufacturer and end user.
BYD’s current best seller is the Yuan EV, which is a BEV subcompact crossover that launched in 2016. It has a range of 190 miles to 256 miles and a post-subsidy price of 105,800–139,990 RMB (US$14,900–$19,700). Its charge time is a little more than an hour. As of May 2019, there was a waiting list of more than 30,000 customers to purchase one.
Table 1 shows a comparison between Yuan and the Wuling Hongguang, the best-selling vehicle in China in 2018. The Hongguang is a gasoline-based compact sports utility vehicle manufactured by the SAIC-GM (Shanghai Automotive Industrial Corporation–General Motors) joint venture.

Click to enlarge.
BYD’s second EV best seller is a PHEV called the Qin, which is a sedan with a price tag of 149,990–169,990 RMB (US$21,100–$23,940). The third is the e5, which is a BEV sedan with a driving range of 250 miles and a post-subsidy price tag of just 129,990–139,990 RMB (US$18,300–$19,700).
The Yuan and e5 are impressive as far as BEVs are concerned. They have decent driving range; some of the accoutrements of a luxury car, like leather seats; and a comparable price tag to a midrange gas-powered internal combustion engine vehicle (ICE). So how much should BYD invest in developing a BEV vs. a PHEV or even an ICE right now?
Here’s how management accounting tools can help answer this question:
- Use cost modeling to determine the true effects of the subsidies and the actual costs. For economic decision making, create a cost model that reflects the organization’s strategic objectives and a deep understanding of its operations, including how to attain the target cost. Include in the model all the subsidies being received, both direct and indirect, in order to properly assess the true per-unit EV production cost.
A costing model should reflect the causality of operations in the business, and the costing system should be based on the costing model. This type of cost model will also greatly enhance the other analyses discussed in this article. A cost model can also be used to compare relevant costs and revenues for various product or service offerings and, based on their breakeven points, determine which products are most profitable and which aren’t. For those with lower profitability, consider dropping the product, increasing the price, or finding ways to lower costs.
- Perform a total cost of ownership (TCO) analysis for each EV option. What is the lifetime cost of an EV from the perspective of the consumer compared to an ICE?Incorporate life-cycle costs into product and service profitability projections. Life-cycle costs include upstream costs, such as research and development (R&D), developing the production process and infrastructure, testing, and acquiring the needed materials or resources. Also included are downstream costs, such as distribution, warranty, support service costs, fuel/charging costs, and disposal or recycling costs.
- Creating an industry technology road map also can help. Even if the EV industry is unprofitable now, imagine the future of the automotive industry in five to 10 years. What will be the penetration and impact of driverless, autonomous vehicles such as robotaxis on overall vehicle demand? Is there increasing integration with companies such as Uber, Didi, and Lyft? What new revenue streams would take place given such a scenario, and will ICEs become obsolete or remain dominant?If available, industry technology road maps are a key tool for CFOs evaluating R&D projects and can be used as a reference point when choosing and managing these projects. They provide an overview of the future needs and technical challenges facing an industry and outline possible solutions.
MANAGING WITH DECLINING SUBSIDIES
In terms of determining whether the new EVs can compete with ICEs, we must first analyze the degree to which the Chinese EV industry is subsidized by the government. Starting in 2010, significant subsidies were made available to EV makers. Essentially, cars above a certain driving range were given a direct subsidy, not only by the central government but also by the city-level government as well, and the amount of the subsidy increased alongside total driving range. Both subsidies have been gradually reduced since 2013, however, and are expected to disappear by 2020.
In addition to the central and local subsidies, BYD also receives a significant amount of subsidies for R&D, EV marketing, EV plant development, and other EV-related areas. Total direct subsidies BYD received, which shows an upward trend and culminated in 9 billion RMB (US$1.3 billion) received in 2018, are shown in Figure 4.
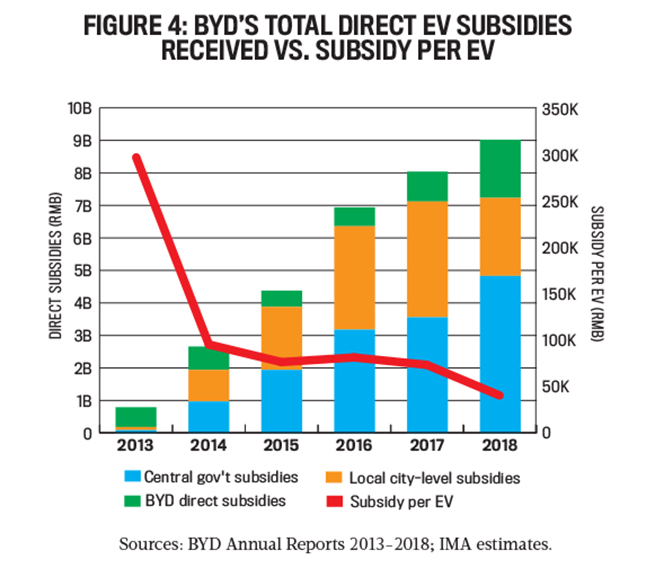
Based on our estimations, it appears that from 2015 to 2017, when the sales of EVs started to accelerate, the impact of the central, local, and direct subsidies per EV was in the range of 75,000–80,000 RMB. By 2018, this figure declined to 40,000 RMB. With subsidies apparently in decline, how can a company be profitable in this industry?
Here’s how management accounting tools can help answer this question:
- Create an estimated long-term profitability analysis for each investment option. For each option, identify estimated costs and revenues over the life of the investment. Compute the net present value (NPV) or internal rate of return (IRR). Compare the impact of diminishing subsidies on future revenues and costs for each option.
- Perform a Monte Carlo simulation for each product option. A simulation takes a random value from the range of possible inputs to all the variables and unknown parameters to calculate a probable output. The result of the simulation is recorded, and the process is repeated. A Monte Carlo simulation runs a solution on the model hundreds or even thousands of times using different randomly selected values from the probability distribution. The advantage of a simulation model is that the whole range of possible values can be included in running the model instead of a single assumed best-case value. This is also known as “what-if” or goal-seeking analysis.
DEVELOPING A COMPETITIVE STRATEGY
For BYD’s Yuan, at an average price of 105,800–139,900 RMB, adding back the 40,000 RMB subsidy to the total end-user sales price would bring the price tag to around 145,800–179,900 RMB (US$20,500–$25,300). As a comparison for the buyer, the current best-selling vehicle in China in 2018 was the aforementioned Wuling Hongguang.
The Hongguang boasts a similar body type to the Yuan but has the following advantages: significantly longer driving range (due to its 50-liter gas tank), significantly shorter refuel time, and a much lower price. At just 49,800 RMB (US$7,000) for the base model, it’s nearly one third of the price of the Yuan. How can companies trying to compete in this turbulent market develop effective, competitive strategies?
Here’s how management accounting tools can help answer this question:
- Use strategic planning tools or concepts, including a SWOT (strengths, weaknesses, opportunities, threats) analysis, Porter’s Five Forces, or a Blue Ocean analysis, to develop a comprehensive understanding of industry dynamics, including competition and direction. Do a SWOT analysis for each potential alternative, including both quantitative and qualitative factors, and select the best opportunity. Consider using a Blue Ocean approach as a strategy-planning approach that centers around creating an entirely new market space and can offer insights into how BYD’s EVs can compare favorably against cheaper ICEs.
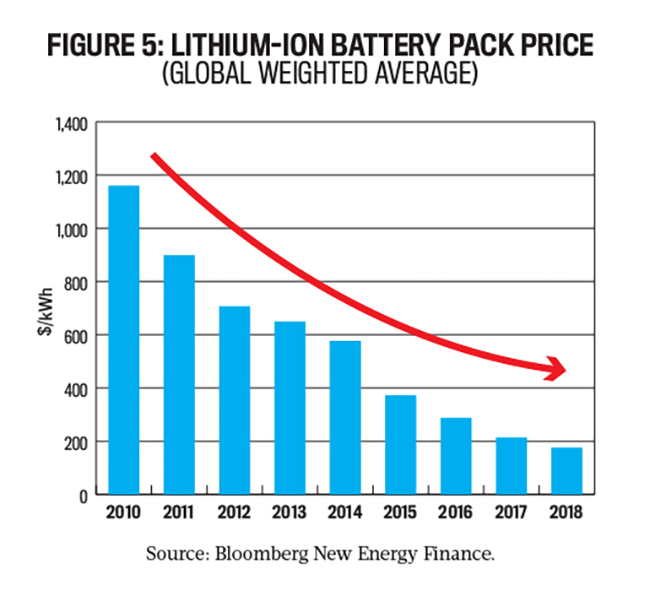
- Use target costing to determine how to achieve the appropriate breakeven cost for each EV to be competitive with an ICE. Target costing is a market-driven management system in which cost targets, or objectives, are set based on defined customer requirements and an assessment of competitive offerings. Target costing is an iterative process linked to the company’s competitive strategy. The two major steps include: (1) establishing the target cost and (2) attaining the target cost or requiring reworking of the product’s design until the target cost is met.Battery cost is the most significant element of an EV’s cost. As illustrated in Figure 5, BYD and many other companies are engaged in an ongoing effort to drive down that cost to compete against ICEs. An important issue to consider is how much lower lithium-ion battery prices can go.
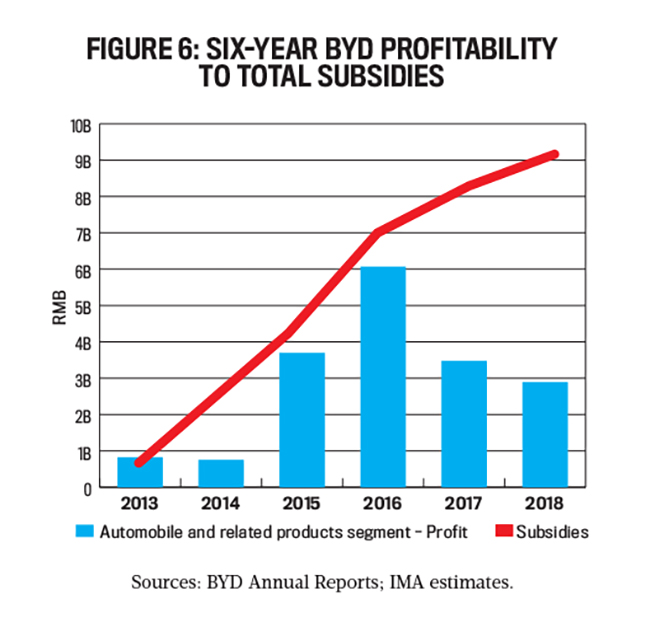
- Use value engineering to properly understand how to optimize each step within the value chain. Value engineering is used to analyze the various parts of a product to determine how to provide their function at the lowest possible cost. This is where most of the opportunities for reducing cost are attained in the design stage. Determine whether BYD can attain the desired target cost within a reasonable time frame.As shown in Figure 6, it appears that since 2013, BYD’s EV-related subsidies have eclipsed its profit margins for the automobiles and related products segment, and this trend significantly intensified starting in 2016. Since then, increasing subsidies haven’t generated additional profitability. The figure also seems to indicate that without significant, increasing subsidies or a technological breakthrough, the profitability of BYD’s auto segment as well as of much of the EV industry will almost certainly decrease once subsidies end.
THE FOUR-STEP PROCESS FOR MANAGEMENT DECISION MAKING
The EV industry is constantly evolving, and it’s difficult to say what the automobile industry will be like a decade from now. As shown in this article, management accounting can be applied in many ways to help companies, governments, investors, and consumers make tough choices relating to EVs. For example, determining the unsubsidized cost of an EV helps clarify the viability of this industry. In general, applying the following four steps can help an interested party make tough decisions in this turbulent industry:
- Define the specific decision to be made and the alternatives.
- Identify relevant financial and nonfinancial information, both quantitative and qualitative, as well as potential risks. Remember that only those factors that differ among the alternatives are relevant to the decision being made.
- Apply management accounting tools to help make an optimal decision, such as:
- Perform cost modeling to properly understand the degree to which subsidies and other factors are helping or hurting the industry and impacting production costs.
- Use SWOT analysis and industry technology road maps (if available) to understand important trends, dynamics, and competition within and outside of the EV industry.
- Apply tools such as target costing, value-chain engineering, total cost of ownership analysis, and long-term profitability analysis to see what benchmarks would need to be achieved in order to become price-competitive with ICEs and other EVs.
- Based on the analysis, make a recommendation, making sure to address the potential risks and opportunities.
This approach can also be applied in essentially any industry. Strategic factors as well as results of profitability analytics should always be considered when making important business decisions, and the analysis should be both qualitative as well as quantitative. Of course, it’s impossible to know for sure what the future holds and the optimal path forward, but with the types of management accounting analyses discussed in this article, it’s possible to decrease the uncertainty for a given decision scenario and determine the mostly likely optimal alternative.

October 2019

