Job security is destined to become a major concern for all in the coming years, with inevitable declines in regional economies and an increase in artificial intelligence (AI). Organizations like IMA® (Institute of Management Accountants) are concerned about how future events will impact their members, especially in terms of compensation. IMA’s 2019 salary survey identifies trends in compensation and other career-related factors among the global IMA membership.
INCREASED REPRESENTATION
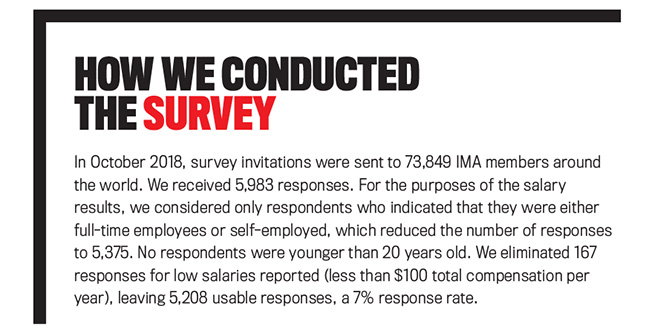
The number of usable responses in this year’s survey totaled 5,208, which is more than double the responses of last year. Members from 78 countries around the globe participated—an increase of 16 from last year. Figure 1 shows the median salary and total compensation from countries with at least 1% of the survey respondents. (All monetary values are in U.S. dollar equivalents as of the time of the survey.) Last year, 50% of the respondents came from the U.S., with the next highest percentage of respondents coming from China (22.8%). This year, approximately 31.4% of the respondents are from the U.S., and 30% are from China. As you’ll see, this and other changes in the respondents’ demographics can impact some of the year-to-year comparisons.
The regions represented in the survey include the Americas, Asia, Europe, and Middle East/Africa. Table 1 summarizes select demographic information for each region. Overall, more men responded to the survey (60%), yet the number of female respondents continues to increase in all regions. Europe had the largest percentage increase in female respondents over last year (14%), with Middle East/Africa experiencing the lowest increase (2%). The Asia region, which includes countries such as China, South Korea, Vietnam, Singapore, Japan, and India, was the only region that had more female respondents (56%).
This year’s respondents are significantly younger across all regions. Their overall average age is 37 years old, which is three years younger compared to last year. Respondents in the Americas (primarily the U.S.) tend to be older (43 years old) compared to those in all other regions, which range from 33 to 35 years old. It’s interesting to note that the Middle East/Africa region, which includes Egypt, Saudi Arabia, United Arab Emirates (UAE), Jordan, Qatar, Kuwait, Bahrain, Lebanon, and others, has the youngest respondents, yet this region also has the highest percentage of respondents in senior or top management positions (39%). This suggests that promotions at an early age are common in this region.
The overall percentage of respondents holding the CMA® (Certified Management Accountant) certification has dropped to 37% in 2018, a decrease of 19% compared to last year. This result may be due to the younger pool of respondents this year. The U.S. has the highest percentage holding the certification (50%), while the Middle East/Africa region has the lowest (26%). The Middle East/Africa region also had the largest decrease (23%) in CMA respondents.
COMPENSATION
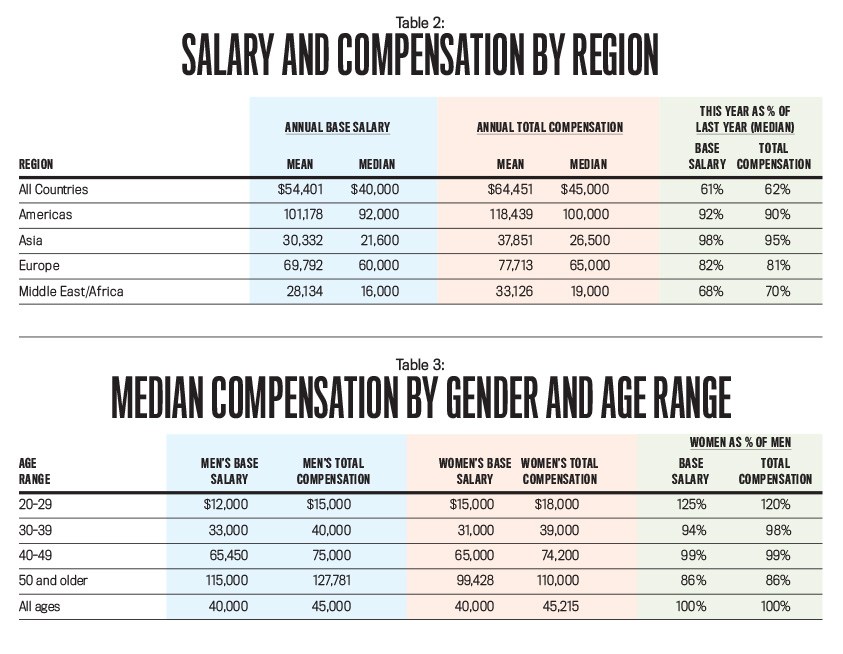
The mean and median annual salary and total compensation by region are presented in Table 2. Globally, average salaries and total compensation have declined. This year, the global mean and median salary are $54,401 and $40,000, respectively. This represents a decrease of 27% and 39% compared to last year, where mean and median salary were $74,344 and $66,000, respectively. Average and median total compensation for 2018 are $64,451 and $45,000, respectively, down from $95,368 and $73,000 in 2017.
Two factors contributed to the observed decrease in overall global salaries this year. First, the total percentage of younger respondents has increased for the second straight year. In 2017, the percentage of total respondents between ages 20 and 29 increased by 2.9%. This year, respondents in this age group increased another 7.3%. This trend holds across each major region, with Europe experiencing the largest shift (a 17.4% increase in respondents ages 20 to 29 in 2018). In addition, this age group had the largest overall decrease in average salary and total compensation (23% and 24%, respectively). Second, the total percentage of non-U.S. respondents increased significantly this year. Non-U.S. countries generally have lower salaries than the U.S. Readers should be cautious about making comparisons of their salary to the global results and focus more on regional or country results.
Annual salary and total compensation vary across regions, with each region experiencing a decrease in annual median salary and total compensation. The Americas region continues to have the highest median total compensation ($100,000) among the regions, although there’s a 10% decrease compared to last year. The Middle East/Africa region has the largest decrease in median total compensation (30%), with Asia having the smallest decrease (5%).
Despite the decrease in the median total compensation for all regions, some countries within those regions remained steady or had slight increases. Within the Asia region, China’s median total compensation held steady. While the Middle East/Africa region experienced a large decrease in median total compensation (30%), UAE had a modest increase in median total compensation (7%).
GENDER PAY DIFFERENCES
The percentage of women responding to the survey in 2018 increased by 3% overall. The good news is that the “salary gap”—represented by the percentage of women’s compensation in proportion to men’s compensation—also improved. Table 3 shows the median compensation by gender and age range. Globally, the salary gap is virtually nonexistent, with women’s and men’s median salary and total compensation being equal. This is an improvement from last year, when women’s median salary and total compensation were both 90% of men’s median salary and total compensation.
For respondents ages 20 to 29, the salary gap improved significantly. In fact, based on this year’s results, the median base salary for women is 25% higher than the median base salary for men in the same age group, a 40% increase compared to last year. This is a good sign that young female professionals starting their careers are on equal footing with their male peers. The gap is more pronounced in the older age groups, but it’s still less than in previous years.
Figure 2 shows the salary gap by region and age group. Again, it’s promising that in three of the four regions, there is little to no overall salary gap for at least one age group. In Asia and Europe, no salary gap exists in the 20 to 29 age group. For those ages 40 to 49 in Europe, women have a higher median total compensation than men. In the Middle East/Africa region, women ages 20 to 29 and 30 to 39 have a higher median total compensation than their male peers.
In the Americas, the salary gap continues to shrink overall. The largest salary gap exists in the 50 and older age group, where the median total compensation for women is 81% that of men. The smallest gap is for those ages 20 to 29 (93%). Even though the salary gap still exists across all age groups in the Americas, the trend is encouraging.
CMA CERTIFICATION
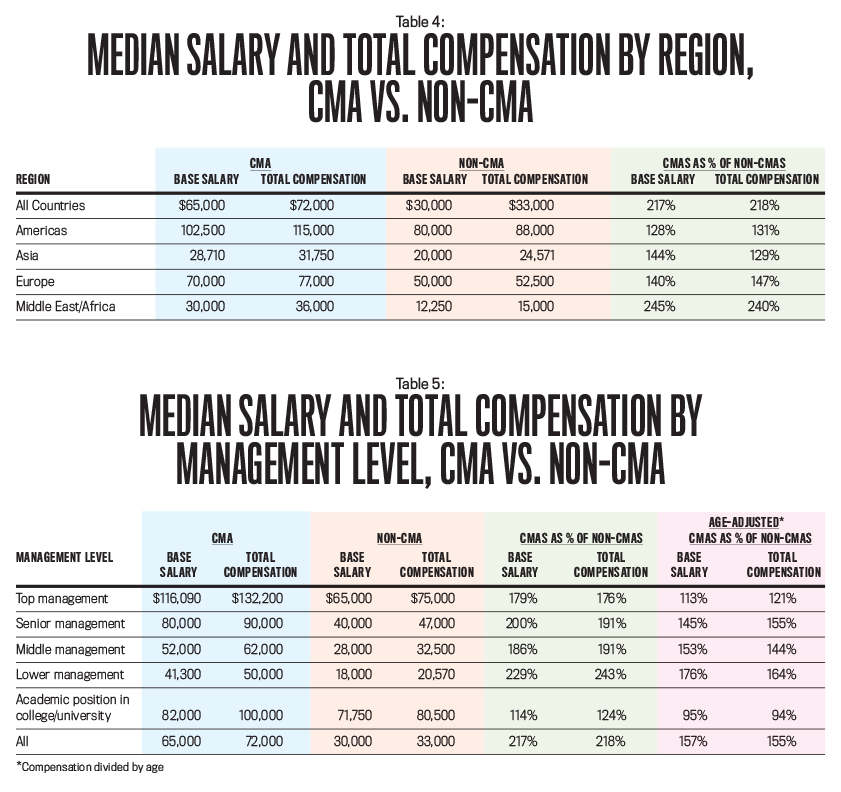
Possessing the CMA certification signals to current and future employers that an individual has a certain skill set that will be valuable in helping an organization be successful. Even though the percentage of respondents holding a CMA has decreased from last year, the results of the survey show that the certification continues to increase in value. Table 4 summarizes median salary and total compensation by region based on CMA certification. CMAs earn more in median salary (117%) and median total compensation (118%), which is a significant increase from last year where they earned 62% and 67% more in median salary and total compensation, respectively.
While this indicates a large change, it’s important to keep in mind there are some demographic shifts that account for part of the increase. Overall, median salaries and total compensation decreased in all regions over last year’s results, but non-CMAs’ salary and compensation decreased much more than those of CMAs (40% vs. 20% for total compensation). Further, the number of non-CMA respondents in their early 20s was relatively greater this year compared to last year’s survey, especially in the Middle East/Africa region where there has been strong growth in the number of new CMA candidates. (In fact, 90% of non-CMAs in the Middle East/Africa region indicated that they intend to pursue the CMA in the near future.)
To better pinpoint the differences between CMAs and non-CMAs, dividing compensation in all regions by age shows that CMAs still have 57% higher median base salary and 55% higher median total compensation than non-CMAs. Looking at age-adjusted compensation allows for fairer analysis when there are considerable differences within age groupings. By dividing the compensation by each respondent’s age, compensation is standardized, and the groupings are more comparable.
The difference in median salary and total compensation for those holding the CMA vs. non-CMAs varies across regions. In the Americas, CMAs earn 28% more in median salary and 31% more in median total compensation, consistent with prior-year results. In Asia and Europe, CMAs earn 29% and 47% more in median total compensation, respectively, again consistent with last year’s results. (Use caution when considering the European results due to the relatively lower number of respondents in that region.)
The Middle East/Africa region has the biggest difference between CMAs and non-CMAs in both median salary (145%) and total compensation (140%). This region had a significantly higher number and percentage of non-CMA respondents this year, as well as a big increase in the mix of non-CMAs in their 20s (from 29% last year to 36% this year). Further, the median compensation for those non-CMAs in their 20s decreased by 42% over last year. Bottom line: There’s a higher number of younger non-CMAs in the survey this year with much lower compensation. After adjusting compensation by age, CMAs in the Middle East/Africa region still have 97% higher median base salary and 104% higher median total compensation.
Aside from demographic differences, the results show that employers continue to place a high value on the skills the CMA validates. “The CMA has intrinsic value for my capabilities, which has increased my professional competency and improved my skills,” noted a 37-year-old male in contract construction from Saudi Arabia. CMAs earn a higher level of compensation across all age groups. CMAs ages 30 to 39 have the largest difference in median total compensation, earning 67% more than those without a CMA in the same age group.
As Table 5 illustrates, CMAs consistently earn more than those without the certification at all management levels. Consistent with prior years, the largest differences are for those in lower management. CMAs earn a median salary that’s 129% greater and median total compensation that’s 143% greater than for those without the certification. This result, however, is somewhat influenced by the higher number of young CMA candidates in this year’s survey, many of whom are from regions with lower compensation overall (e.g., Asia and Middle East/Africa).
The average age of those holding the CMA is almost 40 years old, and almost half (45%) are in middle management. After adjusting compensation by age, the compensation difference is still significant for those in middle management, with CMAs earning a median total compensation that’s 44% higher than that of non-CMAs.
The increase in value isn’t going unnoticed by non-CMAs. In fact, of those respondents not currently holding the CMA, 85% intend to earn the certification in the near future. As in previous years, the value of the CMA is evident from the comments of the respondents. “After I earned my CMA, I was able to get a senior-level role in a new company, and my salary was significantly increased,” stated a 33-year-old senior cost accountant from the U.S. And a budget analyst from Vietnam noted that the CMA “gave me more opportunities to change jobs and earn higher salary packages.”
Many respondents commented on the value the CMA offers employers as a demonstration of a mastery of the critical accounting and financial management skills needed to help businesses make decisions and be successful. A supply chain analyst working in Canada said, “The CMA has given me the knowledge to identify key opportunities in the business, which makes me not only an accountant but also a business partner of my company.” A senior accountant from the U.S. stated, “The CMA is valuable in many areas. It provides a broad understanding of management accounting topics, which creates value to me and my organization.”
Figure 3 compares the differences in median total compensation for respondents in the U.S. who hold the CMA, the CPA (Certified Public Accountant), or both to U.S. respondents holding neither certification. Overall, those holding only the CMA earn 31% higher median total compensation, while those holding only the CPA earn 22% higher median total compensation. Respondents holding both certifications earn 50% higher median total compensation.
These results support the fact that the CMA and CPA validate different skill sets and that those with both certifications are being valued for a wider range of knowledge and skills. Across all age groups, those with both certifications earn a higher median total compensation. It’s interesting to note that the value, in terms of incremental compensation, is much lower for all categories for those ages 50 to 59. Respondents in this age group are most likely far enough along in their careers that other work experience is outweighing the incremental value of certification.
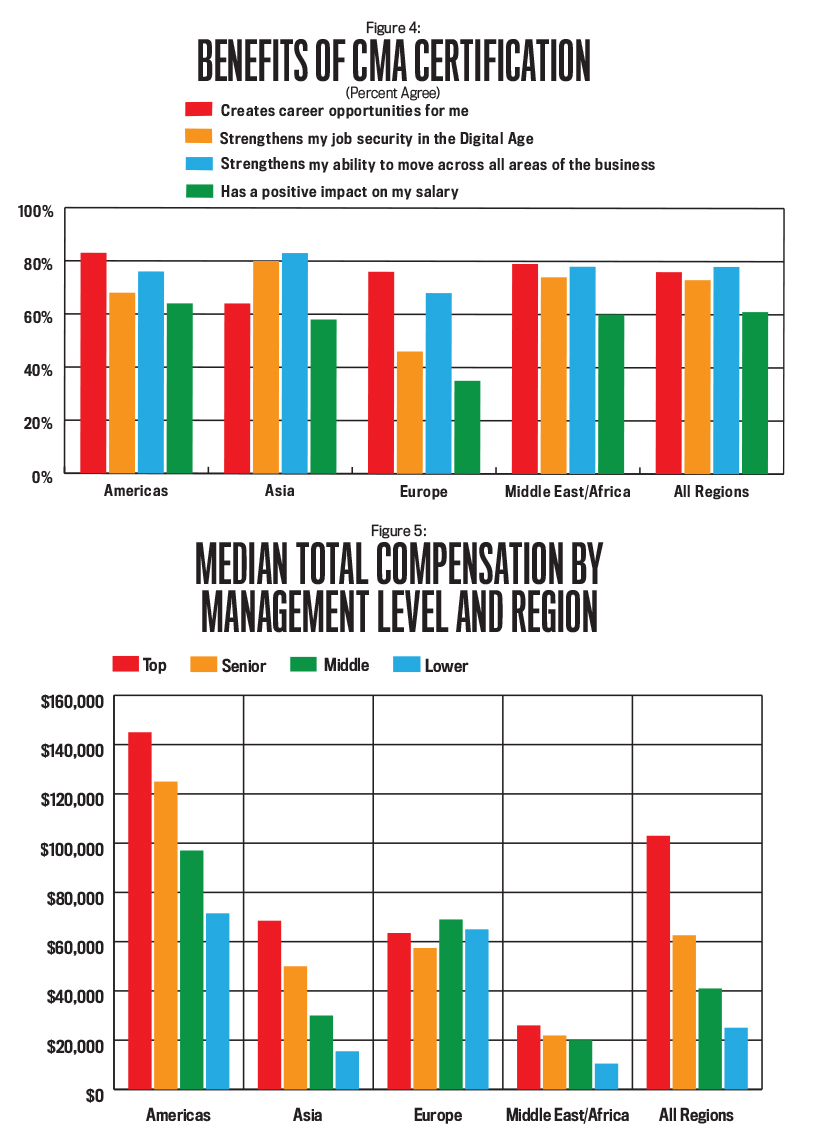
Beyond salary and compensation, the CMA certification can provide other benefits as well (see Figure 4). Across all regions, more than half the CMAs agreed with the benefits listed. Seventy-eight percent agreed that the CMA strengthens their ability to move across all areas of the business, while more than 72% agreed that the CMA strengthens their job security in the Digital Age, which is becoming more important with the increased number of tasks becoming automated or performed by robots.
More than three-fourths of CMAs (76%) agreed that the certification provides career opportunities. A 25-year-old from Saudi Arabia said, “The CMA certification has given an immense boost in my confidence level and the ability to make decisions. I was promoted from the position of an accountant to financial analyst in seven months and from a financial analyst to finance manager in another seven months.”
For respondents currently pursuing CMA certification, career advancement was the most cited reason (75%). A financial reporting manager working in Qatar stated, “I am pursuing CMA certification. I feel this is the perfect finance and accounting course to be part of modern business management and a strategic partner of any organization.”
MANAGEMENT LEVEL
Globally, those in top management earn the highest median total compensation ($103,000), compared to senior management ($62,583), middle management ($41,000), and lower management ($25,054), as shown in Figure 5. The median total compensation for those in top management varies across regions, with those in the Americas earning the highest median total compensation ($145,000) and those in the Middle East/Africa region earning the lowest ($26,000).
Median total compensation increased by management level in all regions except Europe, where those in middle management earn the highest median total compensation ($69,000), followed by lower management ($65,000), top management ($63,500), and senior management ($57,400). The European region also has one of the highest percentages of respondents in middle management, which could be influencing this result.
JOB CHARACTERISTICS
Roles for accountants and financial professionals can vary within an organization, and being able to respond to different roles is important. Respondents were asked how they spent their time as a steward, operator, strategist, or catalyst. The roles are defined as follows:
- A steward safeguards vital assets of the company and manages compliance with financial regulations and external financial reporting.
- An operator runs an efficient and effective finance organization and provides a variety of services to the business (for example, financial planning and analysis, treasury, and tax).
- A strategist influences the future direction of the company by providing financial leadership and aligning business and finance strategy to grow the business.
- A catalyst stimulates change and drives the timely execution of new strategies in the finance function of the enterprise.
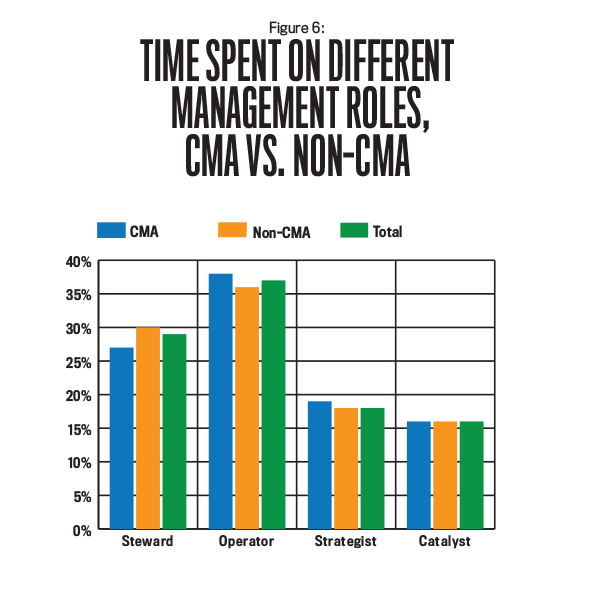
Figure 6 summarizes the average time spent in these roles for CMAs vs. non-CMAs. Overall, respondents spend more time, on average, in an operator role (37%) and less time in a catalyst role (16%). CMAs spend slightly more time as an operator compared to non-CMAs, while non-CMAs spend slightly more time as a steward. Respondents who hold the CSCA® (Certified in Strategy and Competitive Analysis) credential spend slightly more time in strategist and catalyst roles compared to non-CSCAs, though the results are similar.
Overall, respondents spend a small proportion of their time in a strategist role (18%). But, when asked, 68% agreed that their job impacts the strategic direction of the company. These results appear to be at odds but may indicate that all roles play a part in the strategic direction of the company.
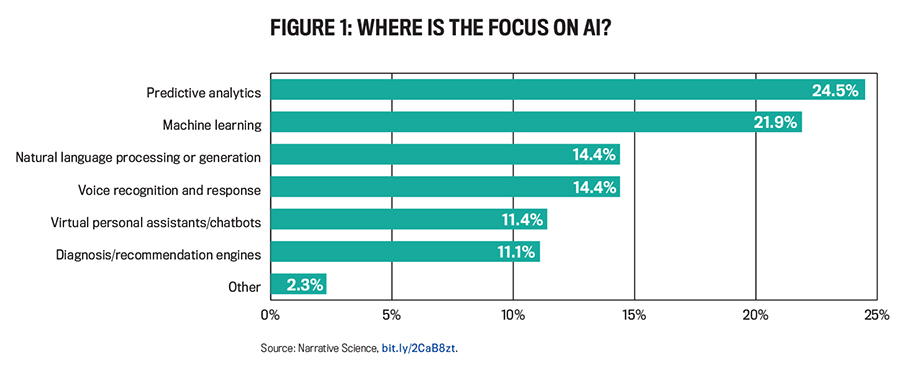
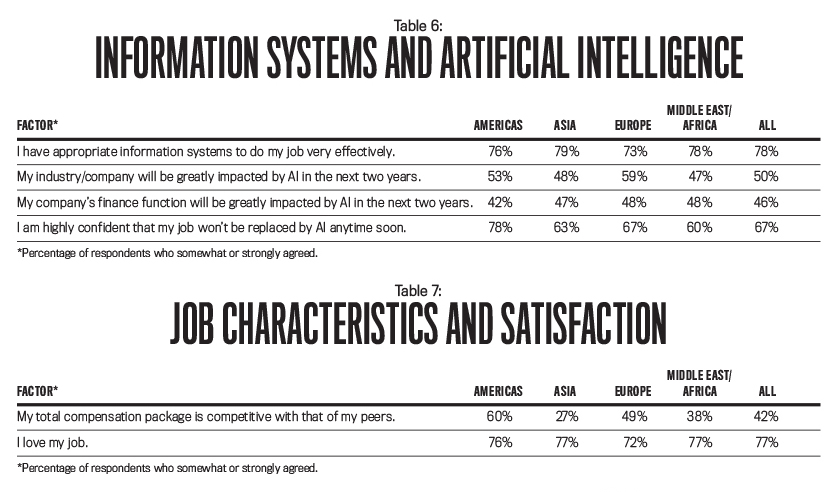
Respondents were also asked about how information systems and artificial intelligence (AI) affect their jobs (see Table 6). Overall, 78% of the respondents felt they had appropriate information systems to do their job effectively. The results for this statement were consistent across regions. Respondents were less likely to agree that their company or finance function would be impacted by AI. Globally, only half of the respondents felt their industry or company would be impacted within the next two years, and only 46% agreed that their finance function would be impacted. Most respondents across all regions felt confident that they wouldn’t be replaced by AI anytime soon.
JOB SATISFACTION
Table 7 shows the percentage of respondents who somewhat or strongly agree that they love their jobs. Overall, job satisfaction has increased compared to last year: 77% of respondents in 2018 reported some level of satisfaction, compared to 58% in 2017. Across regions, Asia had the largest increase in job satisfaction, going from 40% being satisfied with their jobs in 2017 to 77% in 2018.
Job satisfaction increased despite the fact that less than half of the respondents globally agree that their salary is competitive with that of their peers. This indicates that there are intrinsic rewards, such as a sense of achievement, recognition, taking pride in one’s work, and autonomy, that can make up for lower compensation. There are nonmonetary rewards being gained, such as health insurance, retirement benefits, or others. Asia has the biggest difference between job satisfaction and satisfaction with salary (50%), and the Americas has the smallest difference (17%).
Job satisfaction is very subjective and is assessed based on each individual’s unique needs and talents. As stated by a company president in the U.S., “Competitive pay is nice. But being in an organization which is the right fit for a person and part of a good team is even better.” Other factors that may affect job satisfaction include the opportunity for pay raises, forms of additional compensation, and hours worked.
Raises
The percentage of respondents receiving raises has decreased from last year. In 2018, 60% of all respondents received a raise within the last year, compared to 69% in 2017. The Americas had the highest percentage receiving raises (67%), followed by Europe (65%), Asia (62%), and the Middle East/Africa region (49%).
Globally, the median raise in 2018 was 10%, which is an increase over 2017 when it was 6%. Consistent with prior years, Asia and the Middle East/Africa regions had the highest median raise among the regions (10% and 11%, respectively).
Additional Compensation
Employers often provide forms of additional compensation to supplement employees’ salaries. Overall, respondents received 84% of their total compensation in the form of a base salary. Bonuses, profit sharing, overtime pay, or other forms of additional compensation made up the remaining percentage. Asia has the lowest percentage of total compensation coming from salary (80%), while Europe has the highest (90%).
Based on the survey results, 63% of all respondents received a bonus, 13% received profit sharing, 13% received overtime pay, and 26% didn’t receive any additional compensation. The Middle East/Africa region had the highest percentage of respondents who didn’t receive any form of additional compensation (34%). This may be due to respondents in the region receiving higher raises, as noted previously.
Hours Worked
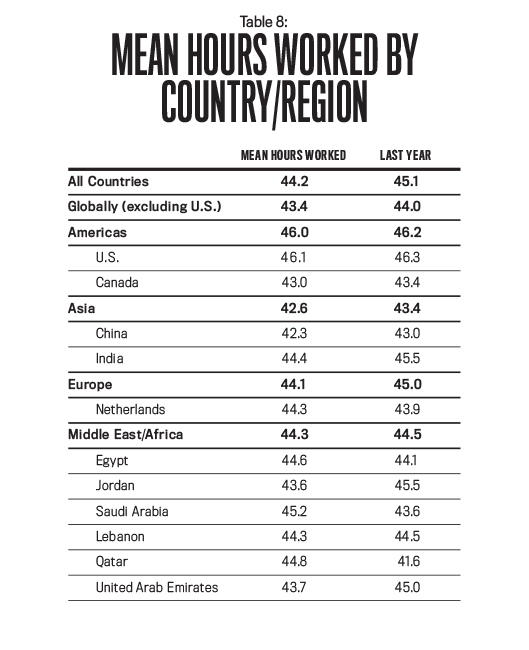
Globally, respondents worked an average of 44.2 hours per week, which is almost an hour less than last year (see Table 8). The U.S. continues to have the longest average workweek at 46.1 hours. Saudi Arabia follows closely with an average of 45.2 hours per week. All regions experienced a decrease in the number of hours worked per week, with Europe having, on average, a workweek that’s one hour shorter. Qatar and Saudi Arabia have the highest increases in the average workweek (3.2 hours and 1.6 hours, respectively).
China has the shortest average workweek (42.3 hours), which is interesting since Asia had the highest amount of additional compensation received as overtime pay among all regions. Other countries with shorter workweeks include Canada (43), Jordan (43.6), and UAE (43.7). None of the countries or regions listed in Table 8 has a workweek shorter than 40 hours.
A NEW, YOUNGER ERA
Overall, median salaries and total compensation decreased for respondents of IMA’s 2019 salary survey. Yet participation in this year’s survey more than doubled compared to 2017, with a large increase in the number of younger respondents. In fact, almost 70% of the respondents in this year’s survey are younger than 40. This has an impact on reported salaries and total compensation because these participants are in the earlier stages of their careers and have a lower earning power than their older counterparts.
The younger set of respondents also likely influenced the reported decrease in the percentage of participants holding the CMA certification. Globally, the percentage of respondents holding the CMA decreased by 19%. This result by itself might be alarming, but the good news is that 85% of the respondents who currently don’t hold the CMA are either in the process of, or intending to become, a CMA in the near future. This is no surprise given the fact that the value of the CMA continues to increase, with CMAs earning 118% more in median total compensation than non-CMAs. The CMA is definitely gaining acceptance and recognition with younger professionals.
We would like to thank all those who responded to this year’s survey. We are grateful for your continued support.

March 2019


