The Partition function returns a string with the range from the start to end values. For aging balances due, we can define numeric ranges to be 1-30 days, 31-60 days, 61-90 days, 91-120 days, and more than 120 days.
MAKE A QUERY
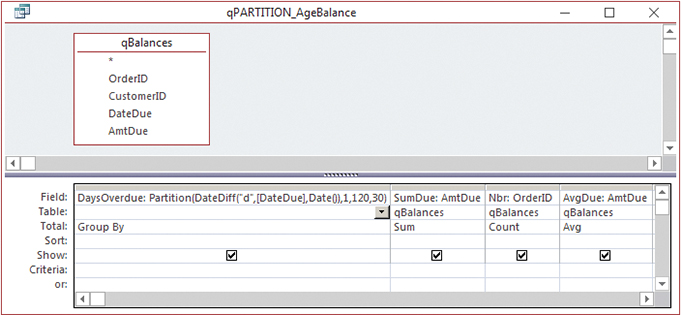
The example database already contains a query named qBalance that assembles the data for unpaid orders with the amount and due date by customer. On top of this, we will create another query to age overdue amounts. Here’s the Design view of this new query, named “qPARTITION_AgeBalance”:
The first step in creating this query is to calculate the number of days overdue. Using the DateDiff function, we can get the number of days between the due date and the current date. We can use the Date() function to return the current system date, and [DateDue] is the field with the due date. (The brackets signify that it’s a user-defined name.)
The syntax for the DateDiff function is DateDiff(interval-string, date1, date2 [ , firstdayofweek, [ firstweekofyear ]]). The first parameter (i.e., argument) is a string code representing the kind of interval we want to use to calculate the difference between the dates, such as days, months, or years. The interval is surrounded by straight quotes, such as "d" for days, "m" for months, or "yyyy" for years. The next two parameters are the dates to use in the calculation. Usually, date1 represents the earlier date. The fourth and fifth parameters are optional. They specify what day you want to use as the start of the week and which week represents the first week of the year. In this case, the interval-string is "d" for days, date1 is [DateDue], the field we use for the due date, and date2 is the current date: DateDiff("d", [DateDue], Date()).
Because we want to place that result into one of our numeric ranges, the next step is to surround DateDiff with the Partition function. The syntax for the Partition function is Partition (number, start-number, stop-number, interval-number), where:
- number is a numeric expression (formula) whose results you want to put into ranges,
- start-number is the beginning value for the ranges,
- stop-number is the end value for the ranges, and
- interval-number is the difference between each range.
In our case, number will be the calculation of days overdue, start-number is 1, stop-number is 120, and interval-number is 30. The final formula (i.e., expression) is DaysOverdue: Partition ( DateDiff("d", [DateDue], Date()), 1, 120, 30). The Total line for this field is set to Group By. (To toggle the Total row on or off, which allows you to group by or create statistics for each column, click the ∑ icon on the Design ribbon.) The other fields in the query are:
- SumDue: AmtDue in the Field cell and Sum in the Total cell. This gets the total amount due.
- Nbr: OrderID in the Field cell and Count in the Total cell. OrderID is the primary key.
- AvgDue: AmtDue in the Field cell and Avg in the Total cell. This gives us the average due in each range. AmtDue is the field name with the amount that is due.
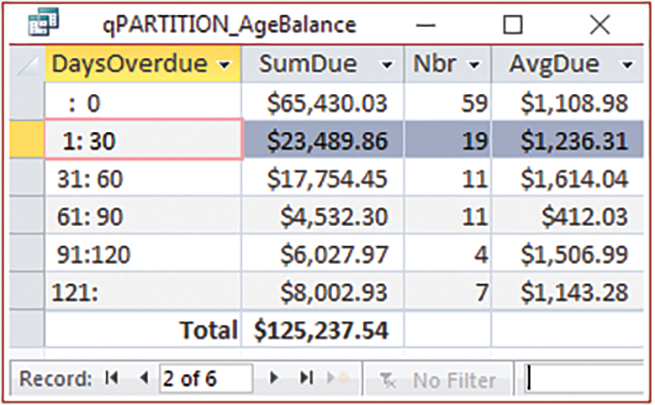
The results look like this:
The first column shows the partition ranges. The first record shows the amounts that aren’t overdue yet but are still outstanding. The second column shows what’s due for each aging range. The third column shows how many orders have a balance, and the fourth column shows the average amount due in each range.
Displaying the total row at the bottom can be toggled off and on in Datasheet view. Similar to the Total line in the Design view, the icon is also labeled ∑ Totals, but in Datasheet view it shows a row in which you can specify the function you want to use in each column of the results. In this case, “Sum” was chosen under the SumDue column to get a grand total. It might also be worthwhile to add a Sum under the Nbr column to get a total number of sales.
The SQL for this query is: SELECT Partition( DateDiff( "d", [DateDue], Date()), 1, 120, 30) AS DaysOverdue, , Sum(qBalances.AmtDue) AS SumDue , Count(qBalances.AmtDue) AS Nbr , Avg(qBalances.AmtDue) AS AvgDue FROM qBalances GROUP BY Partition( DateDiff( "d", [DateDue], Date()), 1, 120, 30);
You can create another query that shows a bar chart for each amount:

The SQL for this query is: SELECT q.DaysOverdue , q.SumDue , String( [SumDue]/1000, ChrW(9600) ) AS ChartDue FROM qPARTITION_AgeBalance AS q;
The ChrW function renders a Unicode character—9600 is the code for the upper-half-block character. The String function specifies a number of times to repeat a character. In this case, we divided the sum due by 1,000. This kind of chart isn’t for accuracy, but is useful for a quick visual. To make the SQL easier to read, an alias of “q” was used instead of repeating the long underlying query name. To make the bars blue, enter [Blue]@ into the column’s Format property.
The 1:30 and 31:60 ranges both round to 17 thousands, which is why the bars are the same width. The sum of payments outstanding but not yet due rounds to 73 thousands, and the column isn’t wide enough to show it all. Since this row isn’t our focus, that’s okay.
Download this month’s database: sf1902_Partition.
SF SAYS:
Age accounts by using the Partition function in a totals query.

February 2019


