Various external stakeholders are emphasizing the need for data analytics skills in business program graduates. For example, IMA® (Institute of Management Accountants) now includes data analytics in both its Management Accounting Competency Framework and the CMA® (Certified Management Accountant) exam. Additionally, the AACSB (Association to Advance Collegiate Schools of Business) standards for accounting programs advocate incorporating data analytics content and learning objectives throughout the curriculum.
The AACSB also calls for students and faculty to develop technology agility—namely, the ability to adapt quickly to new technology. Incorporating data analytics in introductory accounting courses is the first step in providing students with a deeper understanding of how financial information can be analyzed to support management decision making.
WHY INCLUDE DATA ANALYTICS?
Introductory accounting courses teach students a variety of accounting skills, including Generally Accepted Accounting Principles (GAAP), steps in the accounting cycle, and how to prepare a budget. But in an effort to crunch the numbers, students often forget that accounting is truly the “language of business” and can be used for more than just the preparation of financial statements and reports. Providing students with practical, hands-on experience to gather, prepare, and analyze data gives them a much deeper understanding of how financial and nonfinancial information can be communicated to different stakeholders and help management make better business decisions.
Given that most business majors will only take introductory courses in accounting, it’s critical that students understand how data analytics, combined with accounting information, helps businesses make informed decisions. Further, introducing data analytics in introductory accounting courses provides a stepping-stone to more advanced data analytics skills that can be incorporated in subsequent accounting and business courses.
CHOOSING THE RIGHT TOOLS
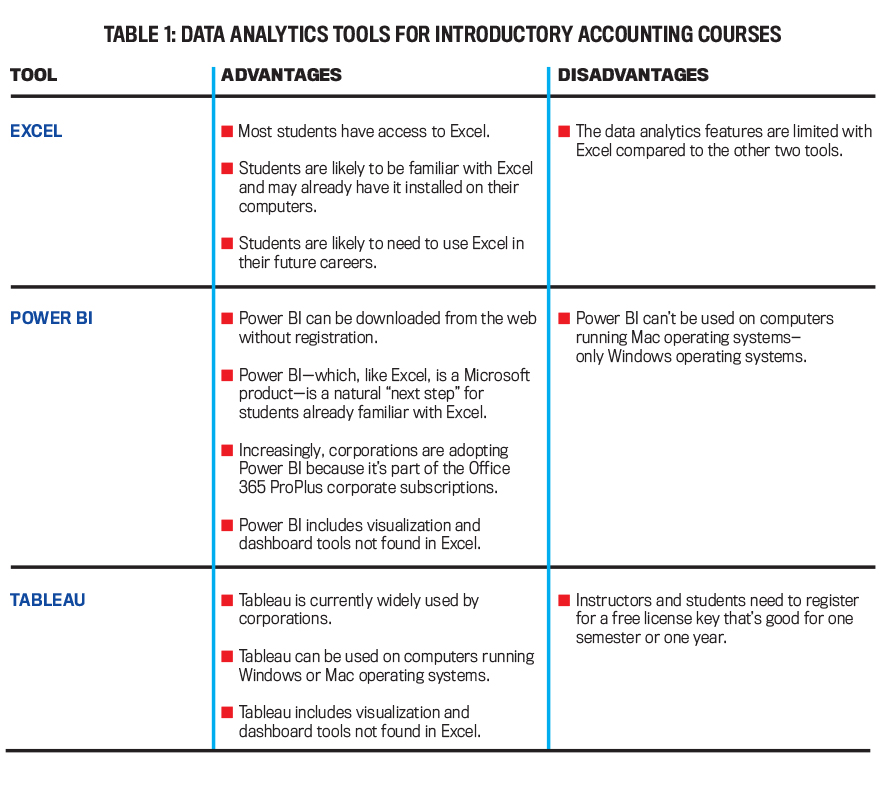
There are several data analytics tools that can easily be integrated into an introductory accounting course, including Microsoft Excel, Microsoft Power BI, and Tableau. The most accessible and familiar tool is Excel since students often have the Microsoft Office suite of programs already installed on their computers. Power BI can be downloaded for free from the web without registration, but its main drawback is that it can’t be used on a computer running the Mac operating system (OS). To run Power BI, users need to install Windows on their Mac. To use Tableau, which can run on either the Windows or Mac OS, instructors and students need to register for a free license key that’s good for one semester or one year.
Table 1 summarizes the advantages and disadvantages of each tool with respect to teaching introductory accounting. It isn’t comprehensive but instead is based on our experiences using each of these tools with our students.
In our opinion, we need to be tool-agnostic in our introductory courses. We aren’t developing experts in Tableau or Excel, but rather we’re teaching students how to learn and adapt to new tools. The pace of technological change is rapid, and we can’t possibly teach students the intricacies of software and systems that don’t yet exist—but we can help our students to be flexible and agile. The AACSB technology-agility requirement makes the case for using multiple software products rather than a single product. Incorporating multiple tools in introductory accounting courses will also highlight for students the differences between the tools.
Fortunately, obtaining each of these tools is fairly easy for both instructors and students. Let’s take a closer look.
TWO MICROSOFT OPTIONS
Microsoft Office 365, which includes Word, Excel, and PowerPoint, is free to most students, either through their schools or through Microsoft itself (bit.ly/2XEv5LC). Because there are still a few differences between the online version of Excel and the desktop version, we recommend the desktop version. The mobile app for Excel isn’t full-featured and often is inadequate for completing a data analytics project. Note, too, that when students download Office 365 for the first time, that version may not be the latest one—they may still have to update Office 365 with a new installation.
Most projects in Excel can be completed on either a Windows-based computer or a Mac, although the commands to perform certain functions may be slightly different.
For Power BI, Microsoft has a free desktop version that both faculty and students can download. (U.S.-based users can find it at bit.ly/2XF6rKz; search online if you’re in a different country.) The free desktop version of Power BI will work for introductory-level projects. The paid versions of Power BI allow collaboration among team members, but they have other features beyond the scope of most projects assigned in introductory accounting courses and therefore probably aren’t worth the cost.
The caveat about the desktop version of Power BI is that it can only be used on computers running Windows OS. The following workarounds might work for students who use a Mac OS:
- Apple’s built-in Boot Camp (apple.co/2LJR4ya) or other utility (i.e., Parallels) allows Windows OS to be installed on the Mac so that Power BI can be used in the Windows environment. Students may have to purchase a copy of Windows OS to install on their Macs, however, and typically the Windows license isn’t free.
- Your school may be able to install Power BI on virtual machines. This option would require the assistance of your school’s IT staff and can be costly if many students need Power BI.
- Your students can use a computer lab where there are Windows-based computers. This option, of course, is subject to availability on your campus.
ACQUIRING TABLEAU
If you’re an accounting instructor, you can obtain a product key for Tableau by going to the Tableau Academic web page (tabsoft.co/2YNSyLz) and filling out the forms to “request individual license” (for the instructor). You can use this Tableau product key to activate Tableau for your individual instructor needs.
Students can obtain a license for Tableau for the semester (or year) using one of two methods. The first option is for students to sign up individually for Tableau by following these steps:
- Go to the Tableau for Students site (tabsoft.co/ 30wWHEd).
- Click the “Get Tableau for Free” button and fill out the form.
- Students should receive the key in a few hours once the form is submitted and Tableau verifies that they’re enrolled at the university.
- While students wait for their key, they can download the 14-day free trial (tabsoft.co/2Jsgv5O) and start working with Tableau immediately.
The second option is for the instructor to obtain a product key for their course for the current semester and share that product key with their students. Go to the Tableau Academic web page (tabsoft.co/2YNSyLz) and fill out the forms to “request individual license” (for the instructor) and “request course software” (for your students). The links are found at the bottom of the page. The course software option will give you one license key that you can share with your students, good for the duration of the semester, based on the course start and end dates you specify on the form. It can take Tableau up to two weeks to issue the license, so fill out the request form at least a few weeks before your students will need to use the software.
FREE CASES
A variety of resources can help instructors incorporate data analytics into introductory accounting courses, including cases developed by accounting instructors, tutorial videos found on the various accounting software websites, and educational opportunities offered throughout the academic year, such as at the American Accounting Association (AAA) regional meetings and the Teachers of Accounting at Two-Year Colleges (TACTYC) annual conference.
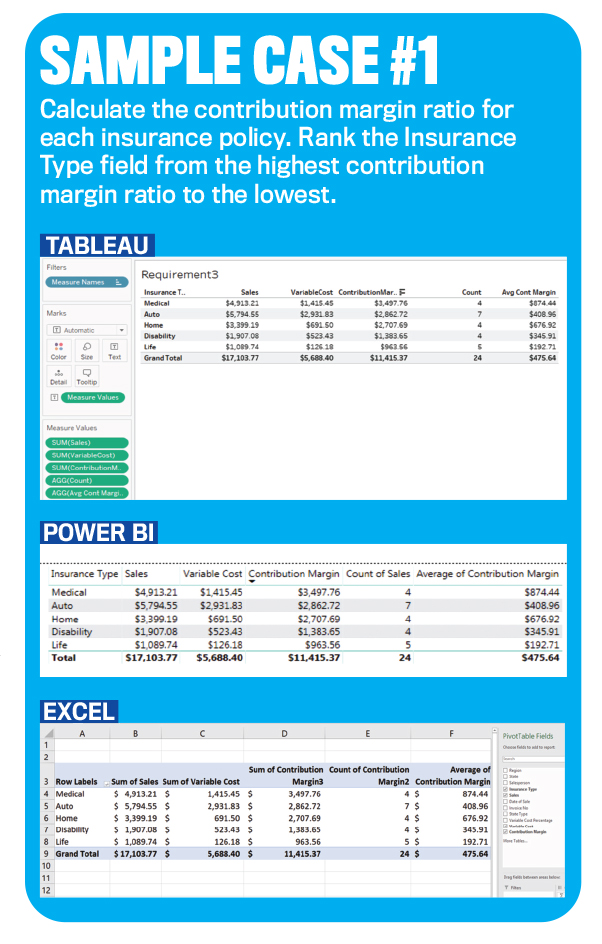
At our universities and college, we’ve developed several free cases suitable for our introductory financial accounting and introductory management accounting classes. The first five cases, developed by two of this article’s coauthors—Wendy Tietz and Tracie Miller-Nobles—incorporate Excel only. Three of these cases require students to analyze financial accounting information (transaction analysis, gross profit analysis, and fixed asset analysis), while the other two focus on management accounting (budgeting and performance evaluation, and contribution margin analysis). These Excel-only cases contain data sets of up to 55,000 records, providing students the experience of working with larger data sets than normally seen in a college-level course.
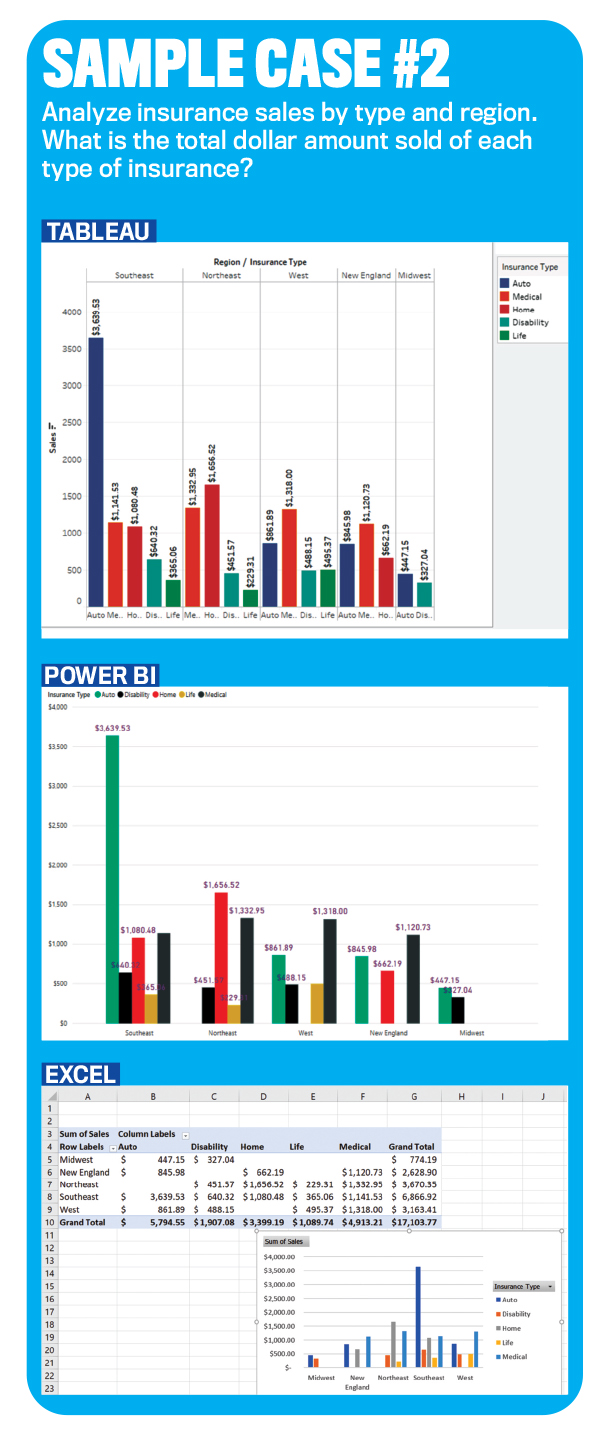
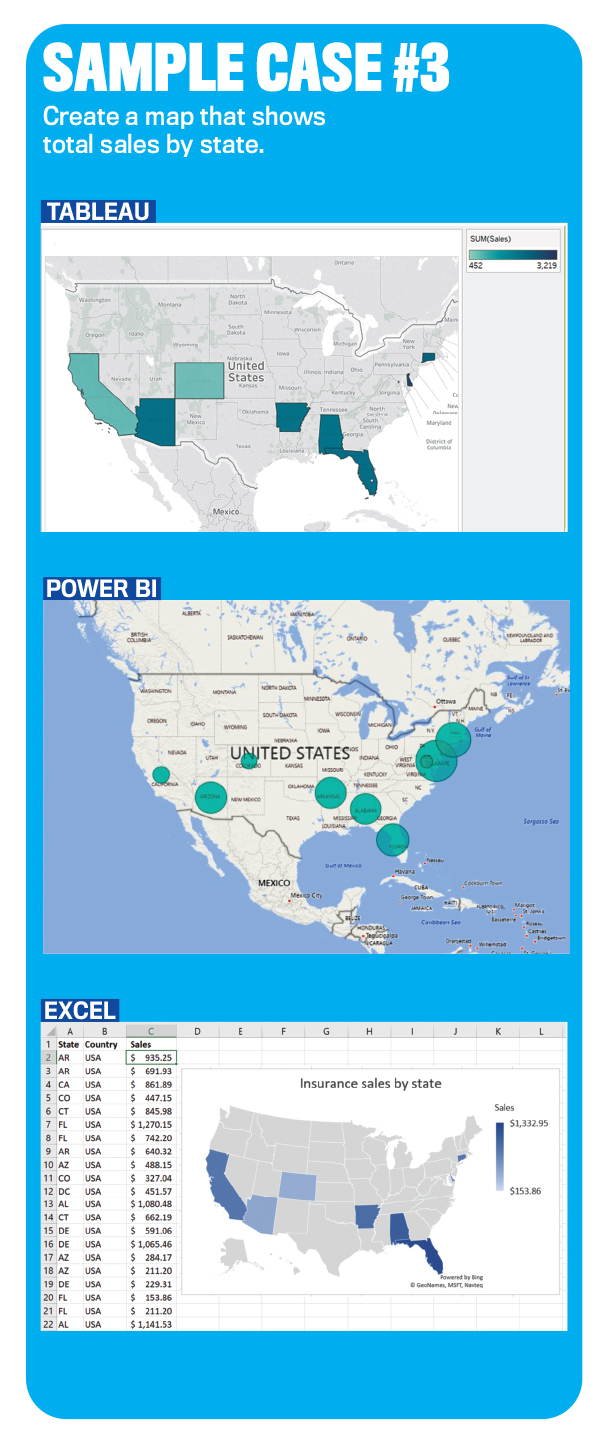
For instructors who want to incorporate additional technology tools, the three of us have developed two cases available for Excel, Power BI, and/or Tableau. The financial accounting case has students clean the data, analyze sales trends, and interpret their findings, while the management accounting case focuses on analyzing cost and contribution margin. These multi-tool projects are based on a national insurance company and contain more than 65,000 records. Additionally, the projects include four versions of the full data set, giving instructors the flexibility to use different versions for different sections or semesters.
These cases, which we’ve used in our own classes with hundreds of students, are available to you and your students at no cost. To access the cases and to request the instructor solutions, see our blogs at iteachaccounting.com and accountingintheheadlines.com.
Depending on the particular case, the following resources may be available to you:
- Case (one-page Word document).
- Instructor guide (Word document).
- Student guide, including frequently asked questions (Word document).
- Data sets (some cases include multiple versions of the data sets).
- Tutorial resources, including a step-by-step video (closed captioned), data set (Excel file), and scripted video slides (PDF).
- Editable grading rubric (Word document).
- Multiple-choice questions with solutions (Word document).
- Solution files (Excel file).
- Check figures for students (Word document).
- Video assignment instructions (Word document).
As mentioned, the strength of these cases and their supporting materials is that they allow for flexibility. The instructor has a variety of choices regarding the tool(s) to be used to complete the data analysis. In some of the cases we’ve developed, an instructor can choose to assign the case using only one of the tools or can require students to use two, or all three, of the tools to complete the same case requirements. With some cases, we’ve provided four algorithmic versions of the data set (A, B, C, and D), allowing instructors to use a different numerical set with each tool or for different semesters or class sections.
OTHER VALUABLE RESOURCES
In addition to the cases we’ve developed, data analytics cases can be found in accounting education journals, such as the IMA Educational Case Journal, and other publications. The following resources also contain a variety of data analytics materials:
- The Sam M. Walton College of Business at The University of Arkansas has several large data sets that are available for academic use only. Information about these data sets can be found at bit.ly/2GfVV6E.
- Owned by Google, Kaggle is an online community of data scientists and those interested in data analytics. Users are free to contribute their own data sets to the site. Kaggle contains hundreds of data sets on a variety of topics, and registration is free.
- Guido Geerts, Ph.D., a professor of accounting at the University of Delaware (geerts@udel.edu) conducts Power BI workshops at a number of accounting education conferences and offers a variety of Power BI materials to instructors and students.
- The Big 4 accounting firms all have general analytics materials on their academic resources pages. Many of the cases are aimed at instructors of intermediate accounting, auditing, or taxation courses. There also are data analytics training materials available at some of the firms’ websites:
- EY Academic Resource Center (EYARC)
- PwC
- KPMG
- Deloitte Foundation
There are online resources that instructors can use and share with their students for all of the technology tools we address in this article. The Microsoft website has a variety of helpful Excel videos, and additional videos can be found on YouTube. The Power BI website provides guided learning videos and examples of dashboards, reports, and desktop files. Power BI also offers a free introductory four-week course through edX that incorporates videos, sample data, and hands-on labs. The Tableau website provides free training videos, including how to get started, how to connect data, and how to create visual dashboards and stories. And lynda.com, an online learning platform often available to instructors and students, also offers video tutorials for a variety of data analytics tools.
We also have benefited greatly from attending multiple educational conferences that focused on data analytics. For example, AAA has several educational offerings throughout the year, including an intensive data analytics summer workshop, pre-conference data analytics workshops at section and regional meetings, and a variety of sessions at annual conferences. TACTYC also offers data analytics sessions during its annual conference, as does the Canadian Academic Accounting Association (CAAA). IMA also provides webinars, online courses, and educational resources focusing on technology and data analytics through its Technology & Analytics Center.
A NEW PRIORITY
In today’s rapidly changing business environment, it’s critical for business students to develop a data analytics mind-set. Regardless of their intended major, they need to develop the ability to analyze large amounts of both financial and nonfinancial information to gain insights and make recommendations to management and to make key decisions themselves.
As we have seen over the years, introductory accounting courses are a great starting point for developing the agile mind-set that students need to rapidly adapt to the variety of tools that they’ll use in their careers. If you’re an instructor—or are considering making the leap to academia from a corporate position or a government post—you’ll have a front-row seat to this rewarding, ever-changing, and challenging data analytics learning curricula in the months and years to come.
August 2019


