The management accounting profession has a very real problem right now with outsourcing and automation eliminating most entry-level jobs. At particularly high risk are the mundane, repetitive jobs we all had as entry-level financial professionals. Remember transactional roles involving general ledger, accounts receivable, or accounts payable? It’s rare to find an entry-level employee performing any part of those functions because the entry-level tasks were automated long ago.
Where are the new entry-level jobs? They’re often in what has traditionally been called analytics application development but is now called data science or data application development. These are entry-level roles, and they require applying data science concepts to execute solutions, even at the lowest level.
For example:
- Using R or Python to build a reusable forecast model including factors like seasonality, geography, and demographic patterns;
- Web scraping publicly available data for competitive analysis; and
- Filing with the U.S. Securities & Exchange Commission (SEC) using Inline XBRL—a combination of HTML, XML, and accounting rules.
As another example, in financial planning and analysis (FP&A), the bulk of time isn’t spent interpreting data—it’s spent transforming and cleaning it. Junior FP&A employees would spend their time making Excel spreadsheets and formatting PowerPoint presentations. But the increasing importance of data auditing requires us to keep track of all the changes we make to data (a.k.a. “reproducible research”). Junior developers are already doing this since code is completely transparent, so coding is becoming the data manipulation tool of choice.
NEW ROLES FOR MANAGEMENT ACCOUNTANTS
But while evolving technology is presenting challenges to our profession, it’s also presenting opportunities. Management accountants can increasingly assume the role of facilitator—using the breadth and depth of their knowledge to find opportunities for improvement and craft a shared vision for product stakeholders.
They already possess most of the skills needed to implement advanced analytics: They have a holistic view of business, they intuitively understand the interrelation between financial and strategic business decisions, and they have strong written and verbal communication skills in most cases. What’s often missing are sufficient technological skills.
By combining business domain knowledge and analytics development competencies, management accountants will have skills to quickly adapt to any tool or framework in a few hours or days of training, not weeks or months. They’ll be able to write the code necessary to execute and operationalize analytics themselves, which will open the career path to architect, product owner, and eventually CFO. It’s no secret there’s a perception among accountants that code is “hard,” but it actually can be easier to get started with it than with any application.
Unfortunately, obtaining the necessary technological skills seems like an impossible feat to some. It isn’t. We’ll describe the competencies that entail practically everything a management accountant needs to know in order to apply his or her domain knowledge and a plan for obtaining that knowledge. The 40 to 80 hours of study we suggest give management accountants the competencies required to adapt to the modern workplace. The small amount of time invested for study is worthwhile.
What does competency mean for management accountants? We view the necessary level of competency as somewhere on the continuum ranging from little knowledge to master data scientist, with the target competency level different for everyone, depending on factors such as career goals, company size, length of career, and organizational culture.
The minimal competency level would be that of an “analytics translator” who understands the data science process enough to work with data scientists addressing business issues. Toward the other extreme are finance professionals serving as embedded data analysts. They have the knowledge and tools to get their hands dirty with data: exploring it, building models, and conveying results to management.
At higher levels of seniority and competence, they ensure analytic systems adhere to accounting data standards (e.g., timeliness, relevance, accuracy, etc.) and confirm that necessary data security measures are in place—in other words “data governance.” These accounting data analysts and solution architects likely will be the focus of new management accounting jobs in the future (“solution” and “architect” are defined in the next section).
Completing this article’s suggested courses gives someone a proficiency level suitable to get started in basic data science—being able to extract data, transform/clean it, analyze it, and the like. This level of competency provides a foundation to build data analyst skills as well as the vocabulary and technical context required for analytics translators.
DATA SCIENCE OVERVIEW: LEARNING THE LANGUAGE
The best way to begin is to learn the terminology. Although some of what we introduce will seem simple, stay with us. Our first term is “architecture,” and just like when designing a building, the architecture is the overall structure of whatever it is we’re trying to create.
The next term is “solutions” because the only 100% consistent aspect of any analytics project is that we are trying to solve some problem or answer a question. “Solution architecture” may take many forms from a simple report performing calculations once a week to an automated artificial intelligence (AI) ultra-high-frequency trading application.
“Patterns” are templates or guidelines that solution architects will reuse frequently. In our new technology-focused terminology, we hope to “architect” a “solution” using an established “pattern.” There are different types of solutions that may use different patterns and/or expertise. At the highest level (a.k.a. “least detailed” or “10,000-foot view”), we typically group solutions into “domains.”
Just as a building architecture may require domain solutions in landscaping, interior design, plumbing, and more, an analytics solution architecture may include domains such as data storage, data creation, and different business specializations. To architect effective analytics solutions, we require competencies in multiple domains of business data.
ANALYTICS SOLUTION DOMAINS
Next we use the following high-level domain design pattern: data creation, data storage, and business domain(s). The business domain may include a single business domain, such as marketing, or many, such as marketing, supply chain, and finance.
What about governance?
Governance is an integral part of every domain. Data capability often is the primary driver of competitive advantage. Now that information is so freely available and the economy largely global, most enterprise goods and services quickly become available from many sources, including foreign entities with little intellectual property (IP) protection and “do it yourself” hobbyists with 3D printers.
Today, “barriers to entry” are almost nonexistent in the physical (i.e., tangible) space; the result is that competitive advantage is largely created in the digital (i.e., virtual) space. This digital competency arbitrage is why data governance is so important.
The fact that the last paragraph made perfect sense to you is exactly why management accountants should be at the center of this new business pattern. It may take 40 to 80 or so hours to understand the technical concepts required, but it takes a lifetime in business to internalize business acumen, strategy, and the insight from an accounting background.
The importance of data governance is also why management accountants need to switch their data access patterns. Currently, data is typically created, aggregated, and visualized in the same spreadsheet application and shared via email. This process is full of nonreusable, undefined calculations with little capability for version control (that is, a consistent master copy).
The concepts in this article give management accountants the capabilities to easily create governed, reproducible solutions.
THE BIG PICTURE
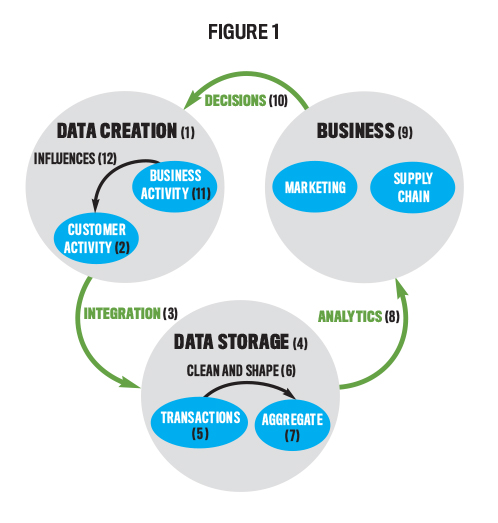
What does the interrelation of data creation, storage, and business domains look like? (See Figure 1.)
Consider a traditional business selling widgets directly to customers:
A. Data is created (1) by customer activity (2) such as purchasing widgets or browsing websites.
B. Data integration (3) moves data between data generating application and into data storage (4).
C. Raw data transactions (5) are cleaned and shaped (6) with other data into an aggregate datastore (7).*
D. Aggregate data is used for descriptive, diagnostic, predictive, and prescriptive analytics (8) by various business domains (9).
E. The business domains use the analysis to make business decisions (10) on how to sell more widgets.
F. Business activity (11) resulting from business decisions influences (12) customer activity.
*Points 2 and 3 (but technically only point 3) are often called “extract transform load” (ETL) because data is extracted from its source, transformed to a usable format, and loaded to an accessible location.
The entire point of this cycle is for the business to better influence the customer. This could be through product design, marketing, support, warranty, shipping, inventory, etc. The business exists to make decisions that result in value to its customers translated into profit. Therefore, the goal of an analytics solution architect is to accelerate the cycle of customer activity to business activity.
Fortunately, management accountants already have a wealth of knowledge concerning the business domain and experience making business decisions that influence customer activity. Even better, that’s the hardest part to learn. Everything else requires learning only a relatively small number of technical concepts and the creative application of those concepts.
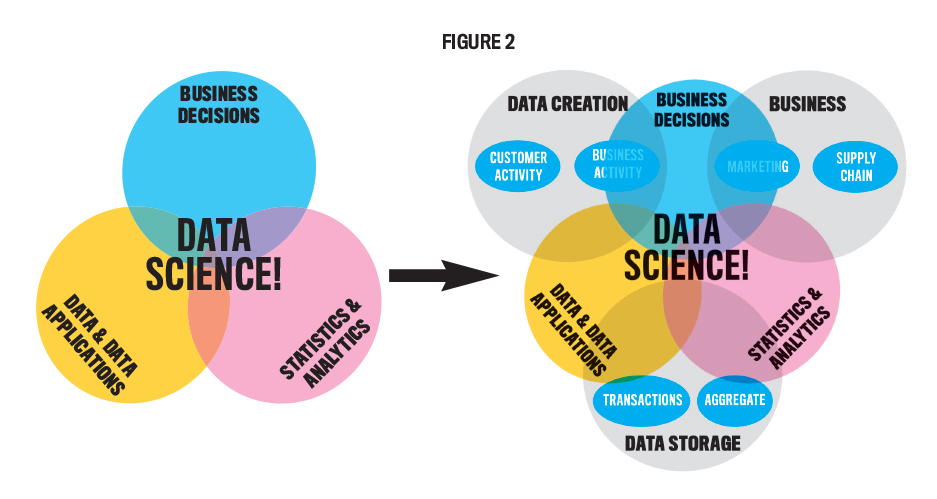
This is data science—the intersection of data, analytics, and business decision making. The current state of data science is to accelerate the data-to-decision process. (See Figure 2.)

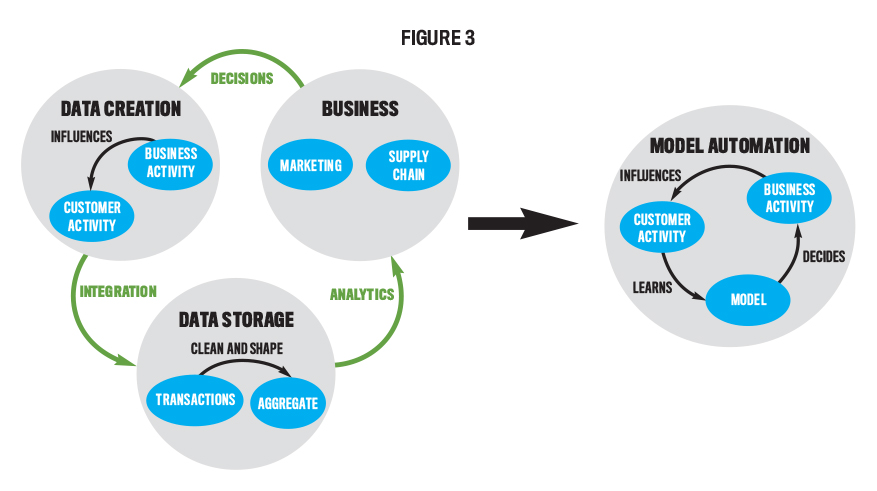
Can management accountants be data scientists? Yes, absolutely. But more than that, management accountants can take the place of data scientists, and data scientists will be happy to let them do it. What many people don’t realize is that data scientists actively try to work themselves out of a job. They consider themselves a success when whatever solution they discovered is so amazing that it gets completely automated. (See Figure 3.)

Yet data scientists traditionally are recruited from computer science backgrounds. They often lack the depth in the business domain of management accountants who, by virtue of being management accountants, are well versed in using business data to inform strategic and tactical business decisions.
That’s more proof that management accountants can make great data science solution architects.
HOW TO LEARN THE COMPETENCIES
As management accountants, what do you need to learn to develop data and code competency? Conceptually it really isn’t much. But it may seem like a lot when you first take a look. Getting started is often hard because the application of the data and code concepts is very domain specific, even solution specific. And because the application of these concepts is different given its context, you can’t learn the concepts in the same way you learned how to use a spreadsheet or how to calculate earnings before interest, taxes, depreciation, and amortization (EBITDA).
Developing data and code competency is closer to how someone learns to paint. There are only a handful of painting techniques to learn, but they may take a lifetime to master. Many people get discouraged when they try to learn Python by Googling something like “How to build a machine learning model in Python” and get so many different answers. Yet if you were to ask “How do I paint a tree?” you would fully expect those different answers because there are a few ways to create a painting of a tree.
Nevertheless, a few concepts will always be the same. There will be paint. You’re going to put that paint on something, and you’re going to use something to move the paint around to make a tree. From there you have many different techniques to choose from. How someone applies those techniques is what defines a good painter. The same is true with data and analytics. Essential competencies include data storage and transformation, analytics and visualizations, and movement of data.
Accountants need to stop fearing code. The hard part is getting it working in the first place; the coding part is relatively easy. Calling code an “advanced tool” implies we first need to get comfortable with the basic and intermediate tools. The learning pathway should be just the opposite: First learn the concepts of how data is created, manipulated, and moved through an enterprise; then learn what tools can make that easier to execute.
DATA SCIENCE SKILLS
Now that you’ve had some background, how can you get the necessary data science skills? Just follow the plan we outline next.
Data Storage and Transformation
(Study time: basics, 1 hour; core concepts, 16 to 20 hours)The past 50 years have seen an exponential growth in data, creating an equally large number of data formats and data management tools. With so many options, it’s difficult to know where to start learning data and which concepts will stay relevant given the changing environment.
Broadly, data structures can be placed into four groups:
- Unstructured—A mess of data with no definition around it. Most work regarding unstructured data is to get it into one of the other formats, so don’t worry about unstructured data for now. Once you know the data format you need, search “how to transform unstructured data into <format>” to solve the specific problem.
- Delimited—While most often seen as a .CSV (comma separated value) extension file, the values may be separated by anything. Delimited files are simply tables with rows and columns.
- Nested or Key Value—XML (eXtensible Markup Language), XBRL (eXtensible Business Reporting Language), MongoDB (MongoDataBase), JSON (JavaScript Object Notation), and others fall into this category. Each data value has a hierarchy of “keys” rolling out to a unique value. (In XBRL, think Balance Sheet > Assets > Cash and Cash Equivalents > Cash.)
- Relational—Most people think of relational database management systems (RDBMS) when they think of structured query language (SQL) or enterprise resource planning (ERP) systems. Although technically any data can be “relational” (e.g., VLOOKUP in Excel), relational data is designed specifically for relational operations.
For the past three decades or so, enterprise data has almost exclusively been relational because of its balance between the data operations of management and manipulation:
- Data Management—CRUD: create, retrieve, update, and delete
- Data Manipulation—join, filter, aggregate
SQL is often used to perform data operations in a relational database. ANSI SQL (a standardized version of SQL) commands are known by every database developer and provide a universal language of data. Even as enterprises move away from relational data to more nested structures, data operations are still performed or are capable of being performed using ANSI SQL commands.
Basic ANSI SQL concepts are extremely easy to learn. Khan Academy’s “hour of code” lesson gives pretty much all you need to understand how SQL accesses and aggregates data: http://bit.ly/2LpMwJr.
Core concepts around data structure, hardware, software, joins, and basic aggregation require only a few more weeks of part-time study. The more advanced concepts such as “windowing” aggregations and data partitions require only conceptual understanding, not the ability to execute. You only need to learn to recognize when advanced operations are needed. Then you can search online for the way to execute them or enlist the help of a data engineer.
We recommend the following course, although again we suggest that you only survey the more advanced lessons (e.g., windowing functions) until you’re more competent in analytics and visualization programming: http://bit.ly/2PB7zfx.
Analytics and Visualization Programming
(Core concepts, approximately 16 to 20 hours of study)
What’s the difference between analytics programming and SQL analytics? There’s a lot of overlap since both use code to perform analytics. But programming is more powerful. SQL is largely “declarative,” meaning you tell it exactly the data you want returned and the specific operations to be applied. Analytics programming is primarily “imperative,” where you program blocks of code to perform certain operations, many times not knowing exactly what happens during the operation.
Consider SQL to be like an individual worker, while programming is like a manager and a team of workers. Some workers may be so skilled they can work independently (e.g., analytics libraries like “sklearn” for Python or “caret” for R), while other solutions may be brand-new so the workers are entry-level and require very specific declarative-style instructions. R is another programming language used by many academics and data scientists. It’s often used for embedding advanced statistics into tools like Tableau and PowerBI. But R language syntax can be confusing for beginners, so we recommend starting with Python, which will make using R much easier once you understand the core concepts.
Fortunately, the specific instructions are just like ANSI SQL (and include ANSI SQL), employing a few core concepts. These core coding concepts, such as variables, functions, data objects, and data operations (filtering, joining, and aggregating, just like with SQL), can be found in many online courses. All of them are important, so we won’t go into detail because they will be covered in the recommended training.
Once you understand the core concepts and can reference libraries/packages in your programmed solutions, you won’t have to do much coding—you can solve most problems simply by determining which package you need to include in your script!
Even better, most analytics-focused programming languages have separate functionality for manipulating and visualizing data, so you can learn both analysis (i.e., data manipulation) and visualization competencies in the same study material.
But we have a word of caution about learning visualizations. Analytics programming is designed to automate repetitive tasks and solve complex problems. When visualizations are automated, the formatting may not be exactly the way you would like. Because visual formatting has many options (size, border, color, position, labels, etc.), visual coding can be very complex. It’s perfectly acceptable to use analytics programming to do complex analysis, producing a new data set, and then use a tool like Excel or Tableau on the created data set for reporting results.
Because it focuses on teaching operations that easily extend to Big Data frameworks while not requiring any additional study time, the following course is a good resource: http://bit.ly/2MwFVCz. This course assumes basic knowledge of Python, so covering basic Python concepts (and skipping the advanced ones initially) in http://bit.ly/2P4VQoG will be very helpful.
If you are able and willing to install Python on your computer and are able to learn from an eBook, http://bit.ly/2wcsnlx is an excellent book that teaches core concepts and practical applications (see “Preparation Tools” for more details).
If you would like to learn more about visual programming in Python, an excellent tutorial is http://bit.ly/2BJThGB. But don’t attempt this before completing Lesson One in the course that focuses on teaching operations.
Movement of Data
(2 to 3 hours of study)Finally, it’s helpful to understand how data moves through your network. A stumbling block when trying to understand the big picture of data architecture is the “pipes” or “highways” connecting the different components as well as the secure connection protocols. A few hours of video can clarify much of the mystery around how we can access data and display our visualizations online: http://bit.ly/2MOzjyR.
YOUR NEW FUTURE
Rapidly changing technology is sweeping the management accounting profession. The good news is that most management accountants possess many of the core competencies necessary to succeed in the digital age. All they need are enhanced technology skills. While this may seem like a large obstacle to overcome, that isn’t the case. By devoting one or two weeks’ worth of study time and using the resources we’ve included, you can master the necessary competencies. Start preparing for your future now!
PREPARATION TOOLS
Khan Academy
One of the most recognized names in online learning. Includes completely free courses in all skill levels in arts, science, math, and computer science.
Typically used by working professionals as a reference when struggling with a specific math or programming concept, such as a concept assumed to be a prerequisite in another training program. Rarely is a full course completed.
Useful for gaining a general understanding of many topics (e.g., hour of code to learn basic SQL, HTML, and JavaScript in one hour each).
Not useful for real-world examples or applied knowledge. Some users may struggle to stay motivated if they don’t understand how gaining conceptual knowledge will provide real-world benefit.
Coursera, EDX, Codecademy, and Udacity
Mixed free and paid learning programs modeled after online college classes (i.e., “MOOCs” or massive open online courses). All offer free lessons and tests; a small fee includes certificate of completion.
Useful for lifelong learners who need structure and (with Coursera primarily) deadlines to complete coursework. Courses often sponsored by software vendors and/or colleges, so the content is relevant for applied and conceptual understanding.
Not useful for learning to solve very specific problems related to your business. Those with limited time and schedules should know that some courses require registration and project submission at specific dates and times.
Udemy and Lynda
Pay-to-learn sites whose business model compensates the course developer based on number of registrations; therefore, they contain many courses with very specific subject matter. If using Udemy, make sure to search for the instructor’s promo code. Not only will this usually reduce the price by 70% or more, but it’s also the primary way the instructor is compensated for your registration fee.
Useful for specific applied knowledge in software tools and/or business problems. Self-paced learning good for those with tight schedules.
Not useful for those seeking highly curated, college-formatted courses. Lessons also typically don’t cover general concepts, so it may be hard to grasp the “big picture” of an idea.
AutomateTheBoringStuff
Probably the most recommended “learn to code” program for working professionals, Automate the Boring Stuff is legendary among practical programmers.
The full program is available free online with supplementary YouTube lessons, as well as a full paid Udemy class. (Be sure to use the promo code: As of this writing, the class is only $10 with code.) It contains extremely real-world examples of how to use Python to make your life easier, including but not limited to: manipulating Excel, editing many files automatically, automating email and text, and automating keyboard and mouse operations.
But it does spend the first few chapters on setting up the Python environment on your local laptop and diving into the concepts of programming.
Useful for gaining a general understanding of programming and tactical examples. The Udemy class supplemented by the free online book gives most of the practical and conceptual knowledge an accountant needs. You’ll still need to learn some SQL.
Not useful for people who can’t or don’t want to install Python on their computer for learning. Often users have to demonstrate competency through completing a course before they are allowed to install it. Other courses provide an online interface for training, so no installation is necessary.

September 2018


