Applications of balanced scorecards, activity-based costing/management (ABC/ABM), lean manufacturing, value chain analysis, and supply chain management have become established practices within the business community. The philosophy of continuous improvement known as Kaizen that’s associated with Just-in-Time (JIT) permeates most of the recent improvements realized in these practices. So what’s next? Maybe it will happen in “real-time spaces” where all utilized, redundant, idle, and opportunity costs will be measured, analyzed, and managed within time frames in real time.
Time is the primary useful metric for managing in real-time spaces because it’s the most meaningful referential metric, and people understand it. The incurrence and utilization of all costs will be constantly monitored and redirected similar to such practices in supply chain management. The cost of dormant resources will be quickly minimized by searching immediately for opportunities to utilize all resources more effectively and efficiently.
To some extent, the costs associated with time in business have been seen as illusory—the “phantom” cost of business. In fact, they are real but are mostly ignored as if they aren’t real. There are some limited instances in business where time has been considered, such as start-ups, wait time, cycle time, delivery time, standby, ABC/ABM, and others. Yet even in these instances, very little attention has been paid to the time-related profitability associated with these conditions or real-time redirections.
Accounting has historically pictured costs as being fixed, variable, or a combination of fixed and variable over some selected range known as the relevant range. They are deemed to fit in a square box even though the parameters are sometimes significantly jagged, requiring excessive resource capacities on hand to service peak demands. Without dynamic resource balancing, profits per spaces of time are choked out because of imbalances among multiple bottlenecks. Thus, they are held as constant rather than dynamic or elastic. This violates the very foundation of the JIT philosophy where the goal is profit changes representing improvements.
Perhaps the most universal metric could be the cost per second or minute of an activity, resource, or the entire company. Coupling this with the velocity of movement and the volume of occupancy passing through time frames could become somewhat informative. This is one of the primary principles used in supply chain management systems. When you combine the measure of cost utilized within the same time frame as earned revenue, you can better visualize the actual and potential real performance of resources.
TIME IS IMPORTANT
Almost everyone understands time because it’s a personal resource, too. Just ask an unemployed person, and he or she can relate economic well-being to time with and without paychecks. Older people understand the lapse of time and their failures to make use of that allotted to them in the past—even the missed opportunities to earn and store for the future. Workers who are juggling numerous projects that have specific deadlines and whose boss asks for something else to be done “now” understand time.
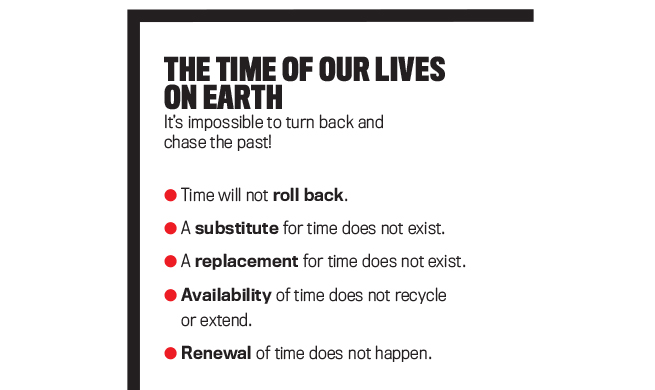
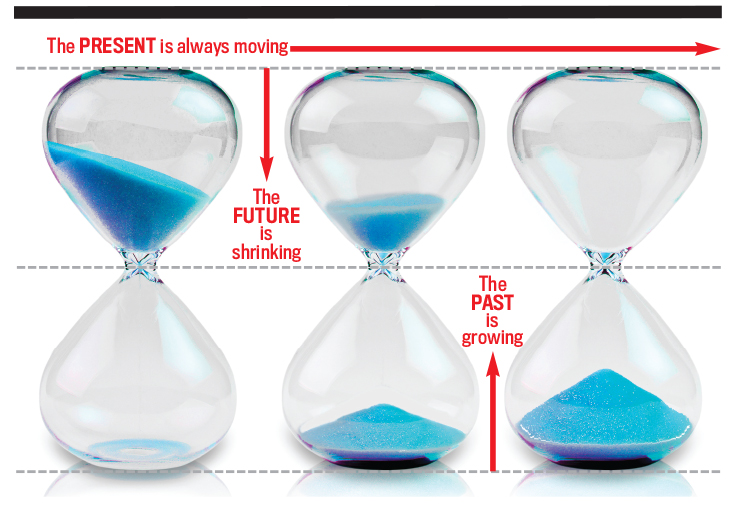
Ask football coaches, and they will probably tell you that the current game is the most important one and if they don’t win in the short run, they may lose their opportunity to coach later. The “windows of life-time spaces” is a critical diminishing resource for all of us. Organizations may exist for many years to come, but in the future these entities will be occupied by new generations of owners, employees, suppliers, and customers. “The Time of our Lives on Earth” (below) provides a vivid picture of the principles of the availability of time to any generation of people or era of an organization.
We are equally locked within the boundaries of time and passing frames. In business, time is fixed within fiscal years, quarters, months, weeks, days, hours, minutes, seconds, and more. Time isn’t storable for the future, and it isn’t a renewable resource. It can’t be expanded or propagated. Time seems to consume itself without being driven. And in the business world, every moment in time seems to have a cost—incurred and/or lost opportunity.
ON THE FRONTIER OF ECONOMIC TIME MANAGEMENT
Recent developments in supply chain management show that progress in this direction is taking place. On December 1, 2013, CBS’s 60 Minutes TV program reported that Amazon was working on a way to get packages to customers in 30 minutes or less via self-guided drones. Amazon.com Inc. said it was working on the Prime Air unmanned aircraft project but that it would take years to advance the technology and for the Federal Aviation Administration to create the necessary rules and regulations. In December 2016 in England, Amazon made its first successful drone delivery—a package weighing up to five pounds. Apparently, the advances yet to be accomplished have more to do with guidance systems, traffic control, and government regulations than the means of delivery. Even though the delivery drones are a work in progress, Amazon says it still shipped more than five billion items via its Prime service in 2017.
On this same 60 Minutes show, Amazon revealed how it’s utilizing every feasible cubic inch of warehouse storage space by fitting products into optimum space mixes without regard to what the products are, thus fully utilizing storage capacity. Computers keep track of storage locations and direct the order pickers to the closest order fulfillment selections.
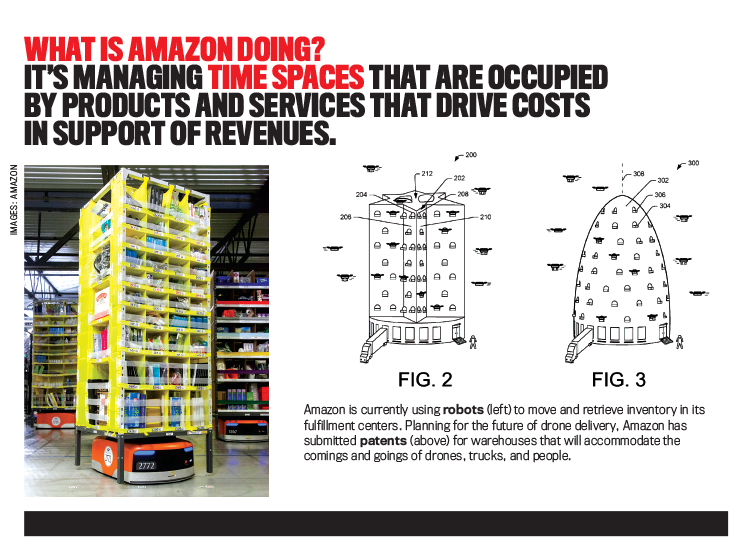
Information technology has virtually eliminated many of the time-consuming chores formerly performed by humans in storing and retrieving objects of access, such as inventories, equipment, and records. Instead of humans searching for a place to store something for later retrieval, determining whether an item is even available, or locating it for retrieval, computer systems are capable of identifying the best available location to store items for later retrieval in less time than it would take for a human to say, “Hmm…I think it’s way over there somewhere. Wait while I go look for it.” Also, by September 2017, Amazon had 140 fulfillment centers that are semi-automated and where thousands of employees are being helped by a staff of robots that do the heavy lifting, climbing, and similar duties. By the end of 2017, Amazon had added more than 75,000 robots to its fulfillment network that year.
What is Amazon doing? It’s managing time spaces that are occupied by products and services that drive costs in support of revenues. ABM claims that activities consume costs and that objects such as processes and products consume activities. Time-based management (TBM) allows managers to analyze and control these cost-incurring activities within spaces of time such as seconds, minutes, and hours.
COST OF TIME
In an economic world, all resources have financial costs in the form of consumption, dissipation, or foregone opportunities. The question of whether or not there is a direct cost of time as opposed to some cost that occurs in a time space simply begs to avoid the accountability for this limited resource called “time.” The path through periods of economic turbulence is usually filled with management crises as the ability for cost reversibility becomes difficult. While variable costs can be disengaged in the short run, fixed costs tend to require longer periods of time to remove or diminish.
The most fundamental metric in business has its foundation in the costs per unit of time, whether incurred or foregone opportunities. Indirect costs sometimes appear as an economic “phantom” when actually they are real. They only appear to be an illusion. Time shouldn’t be considered the phantom cost of doing business.
Some costs vary directly with the number of units produced. Others are fixed in total over the period of time that management uses in the monitoring process. Still others vary, but not strictly with units produced. For example, the average costs of machine or process setups generally vary with volumes, the number of product or process changes, and complexity that takes place within a given time period. Also, a batch size affects the time consumed per setup. A new batch of products requires a machine setup whether the batch contains one unit or 1,000 units. The number of product changes generates the incurrence of setup costs, but the number of units produced per setup drives the time-space occupancy, which can be linked to setup costs. Cost minimization can be a moving target in real time. Pockets of downtime costs are driven further by production time-outs and, on the other hand, idle setup resources.
In some situations, costs go up and down proportionately with the cost driver. For example, if the driver is units produced, then materials, energy, and piecework labor vary with the driver. Suppose workers receive $2 per bushel basket to pick peaches from an orchard. The cost driver would be “baskets of peaches,” and the cost driver rate would be $2 per basket for labor. If the grower incurs other out-of-pocket costs of $5 per basket and sells the peaches for $10 per basket, the contribution margin would be $3 per basket and remain so throughout a relevant range of production. Within this relevant range of production time, we usually assume there are no relevant fixed costs to our analysis. If so, then we must look beyond contribution margin to operating profits to measure real profitability.
Alternatively, suppose the grower hires peach workers by the day and pays them $120 per day. Management would compute the cost absorption rate by dividing the $120 by the estimated number of baskets of peaches those workers would be expected to pick during a day. If the grower estimates the workers will pick 60 baskets per day, then the cost of resources used would be estimated at $2 per basket. This is the same as the piece rate of $2 per basket, but that assumes that the workers will pick 60 baskets each and every day.
If a worker picked only 55 baskets in a given day, which is equivalent to an absorption cost of $110 using the piecework rate, then the grower would have lost the unrecovered $10 ($2 5 5) labor cost plus the contribution margin (price minus variable out-of-pocket costs) for the five baskets not realized. This results in a cost of $120 for resources supplied, which would be disaggregated into $110 for resources used and $10 for resources not used. Thus, there’s a one-day (time) unrecovered cost of resources provided of $10 and an opportunity cost equal to the total contribution margins of five units of product of $15 ($3 5 5), an impact totaling $25. Together, these two costs—incurred supply and opportunity—appear as an economic phantom even though they’re real.
There are consequential issues of cost recognition and benefit management as related to the incurrence of costs measured within “moments of time.” Cost minimization is seen as a prudent target for real-time management of both incurred and opportunity costs.
When operating levels are well below capacity, it can be useful for managers to understand cost behaviors as they plan to utilize existing idle capacities in the future. The goal is to constantly convert idle capacities to utilized capacity. Downsizing can sometimes result in a decline rather than growth in the economic well-being of an organization. It’s important for managers to know these costs as they spend marketing resources to access revenues in the future to absorb the costs of these previously unused capacities. These costs are important considerations when making incremental decisions, regardless of the time horizon.
Again, the football coach will remind us that we need to win in “now time.” In this context, idle capacities should be viewed as opportunities to fill current spaces in real time with more profitability.
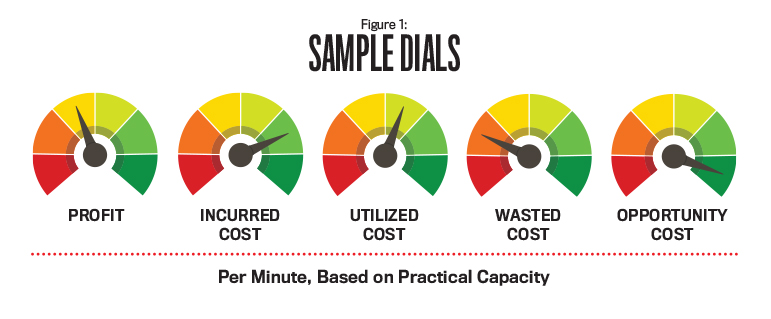
If the denominator of measurement is time, then the key performance indicator (KPI) becomes profitability per unit of time. As each minute of business takes place, the managerial navigational dashboard should display the benefits realized based on resources utilized in one dial separately from other dials tracking the costs of resources provided. Figure 1 provides a few samples for illustrative purposes, emphasizing the monitoring aspects of dashboard dials displaying KPIs. Many styles of dials can be used, and some dials showing tracking numbers could be useful. Each business would select or design dials based on its preferences.
Among the dials tracking the costs of resources provided, there should be dials showing the costs of capacity-sustaining activities, marketing activities, customer activities, product activities, batch activities, unit activities, support activities, logistical activities, research activities, labor-relations activities, sustainability activities, compliance activities, public relations activities, investor relations activities, and business development activities. The common relational denominator among these activities is time. Management accountants must not ignore the costs of providing any of these activities.
This approach is simple and can be calculated from most existing financial accounting systems without an expensive development effort. It could begin with something simple such as gross profit or net operating profit per day (a measure of time), per week, per month, and so on. Walmart tracks average sales dollars per customer visit and includes this metric in its annual report to stockholders. Years ago, IBM reported sales dollars per employee. Employees are more apt to respond positively to KPIs that are easy to understand and seem practical.
PLACING THE ANALYSIS INTO TIME FRAMES
The length of time frames should be selected based on control and reaction points. When any business process or activity gets out of control and the effect is significant, then this moment in the timeline is critical. This marks the point of measurement where a corrective response may be needed. Only when we know the relevant costs associated with a unit of time within a time frame can we accomplish prudent economic analysis and reporting.
Robert Kaplan and Steven Anderson introduced the utilization of time as a metric with the concept of time-driven activity-based costing (TDABC). Anderson originally developed the concept in 1997 and practiced it through his company, Acorn Systems, Inc. In 2001, he worked with Kaplan, a professor at Harvard Business School and codeveloper of ABC and the balanced scorecard, to improve the approach. (See Robert S. Kaplan and Steven R. Anderson, Time-Driven Activity-Based Costing, Harvard Business School Press, Boston, Mass., 2007.)
TDABC is certainly a step in the right direction. But, so far, this practice hasn’t taken the velocity of movement or the volume of occupancy within time frames into consideration. TDABC seems easy because these systems require only two estimates: the capacity cost rate (unit cost of supplying resource capacity) for the primary resource activity and the usage by each transaction encountered by the cost object. Yet the number of unique activities can become large, and the levels of assignments can escalate, thus creating high volumes of process-tracking events with no regard for the time accelerations and decelerations taking place. Economic effects of these changing movements suggest that relevant time measurements are multidimensional while TDABC is one-dimensional.
With the simple dials I’ve suggested in this article, management can see the effects of velocity and volume. Trend dials would reveal changes of velocity and volume.
ROUND HOLES INTO SQUARE BOXES OR SQUARE HOLES INTO ROUND BOXES
Because of bounded and unbounded constraints, some inefficiency (waste) is likely to exist. TBM attempts to identify the costs of waste so that management can eliminate abnormal waste and minimize normal waste. This is resolved by understanding and controlling the timing of cost spigots and/or utilization flows where the occurrences of costs aren’t netted in real time. In order to do this, these cost flows must be visible in simple KPI dials.
Occasionally, normal waste in one product or service could be viewed as an opportunity for new revenues. Without some underutilization of resources in a primary product or service, there are no visible alternatives for other products or services using some portion of existing resources. The key in this area of analysis should focus on incremental effects within relevant time spaces.
ENTERPRISE OPTIMALITY
Goal-congruent, enterprise-wide profitability exists when distributed value-sensitive decision-making groups network to connect optimality analyses and activity spigots together in a real-time information environment. Time-related measurements appear to be the most feasible metrics for communicating through such a network.
A simple but useful beginning metric would be to relate contribution margin or operating profit before income taxes to a unit of time such as an hour or minute.
FURTHER ANALYSIS
My goal in this article is to alert readers to the value of using time as the primary denominator for measuring business revenues and costs. What’s next? Maybe it will happen in real-time spaces where all utilized, redundant, idle, and opportunity costs will be measured, microanalyzed, and managed within time frames in real time using a calculus programming profit optimization model. In this model, revenues and costs are linked to moments of time within time-phased events and occupancy-relevant boundaries involving the product of revenue/cost elements and quantity of time.
The incurrence and utilization of all costs will be constantly monitored and redirected by integrated real-time spigots similar to such practices in supply chain management. The cost of dormant resources will be quickly minimized by searching immediately for opportunities to utilize all resources more effectively and efficiently. It will work like a power grid where electricity is shifted quickly among locations where there’s opportunity to balance load utilization. It could lead to effective resource sharing among facilities that use similar resources that are readily transferable.
Several years ago I worked as a controller in a large, full-product-line dairy products company. The cows often produced more milk than the company could sell within a safe expiration date. The best way to manage this situation is to convert the milk to a product that can be stored for an extended period of time or to sell the excess milk daily without processing to another milk processor. The alternative product conversions included:
- Making hard-frozen ice cream during the winter and keeping it in storage at very low temperatures. Then we raised the temperature during the summer and placed the ice cream with customers. Hard-frozen ice cream has a much longer shelf life.
- Making condensed milk in cans at any time and then selling it to customers when demand permitted. This product has excellent shelf life.
- Making cottage cheese at any time. Its shelf life is much shorter than the shelf life of condensed milk but longer than that of fresh milk products.
We usually made these rerouting decisions intuitively. Today, IT resources, such as Microsoft Solver within Excel, can be used to make these rerouting decisions analytically with greater prudence. Minimum and maximum limits can be set based on storage capacity and projected sales demand. Using the Simplex Linear Programming methodology, you can calculate the resulting product contribution margins by determining the optimum economic use of the excess milk.
As a performance metric, we used value or cost per hundred pounds (cost per hundredweight, or cwt) of milk. We used pounds as the denominator instead of gallons because of variations in the valuable butterfat content within a gallon of raw milk. A higher percentage of butterfat content costs more and increases in weight accordingly. That’s why skim milk at the store is cheaper than whole milk. Skim milk typically contains 2% butterfat or less, and whole milk usually contains 4%. Premium ice cream may contain 8% or more butterfat, while economy ice cream will contain lower levels of butterfat. Though weight works for the dairy business, it isn’t useful for other businesses. Time is a better understood metric base that can be used by all product lines and service businesses, including the dairy industry. Time is universal.
It’s important to establish a baseline where the contribution margin mix is located at a feasible optimum within the level of capacity. The optimum product/service mix level of a company resides at the point where the total profitability is at its doable peak within the boundaries of all limiting resources. After establishing a baseline for optimality, the next step would use flexible costing to monitor actual performance. This would be followed by mix analysis and efficiency tracking to establish a more robust management information engine. Optimality is seen as a prudent target for real time management of both incurred and opportunity costs.
Feasibility of this proposed platform is demonstrated by the internet, where access to object-oriented information is facilitated in real time. Using a search-engine-like algorithm would result in finding opportunities for immediate resource transferability.
KEEP MEASURING TIME
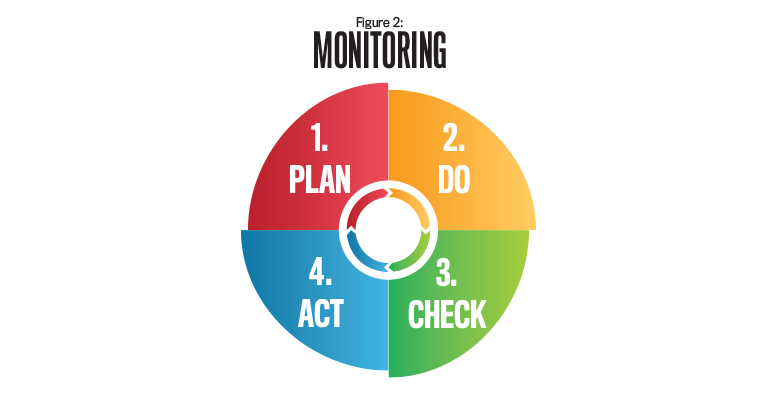
A key idea in management accounting is “You get what you measure!” In other words, performance measures greatly influence the behavior of managers. But they need to be easy to understand and be relatable to issues managers deem important. In any event, as shown in Figure 2, management needs to (1) plan, (2) do it (execute), (3) check what happens, (4) act (respond to what happens), and monitor KPIs constantly (all the time).
February 2018


