

This report presents high-level results from the annual survey and compares compensation levels and job satisfaction around the world. This is the third year IMA has conducted a single global salary survey, enhancing regional comparisons and making trends easier to track. Additionally, it examines other factors that contribute to job satisfaction, such as hours worked, opportunity for advancement, and work-life balance.
How We Conducted the Survey
In September 2016, survey invitations were sent to 33,336 IMA members around the world. We received 2,588 responses, a 7.8% response rate. For the purposes of the salary results, we considered only respondents who indicated that they were either full-time employees or self-employed, which reduced the number of responses to 2,455. No respondents were younger than 20 years old. We eliminated 23 responses for low salaries reported (less than $100 total compensation per year), leaving 2,432 usable responses.
A GLOBAL RESPONSE
Responses to the survey were indeed global, with a total of 2,432 usable responses coming from 81 countries across the globe. Figure 1 lists those countries that included at least 1% of survey respondents (as well as Turkey, Germany, and Switzerland, which historically have had a significant number of respondents), along with their median salary and total compensation. (All monetary values are in U.S. dollar equivalents as of the time of the survey.) The number of U.S. respondents was almost 47% of this year’s participants.
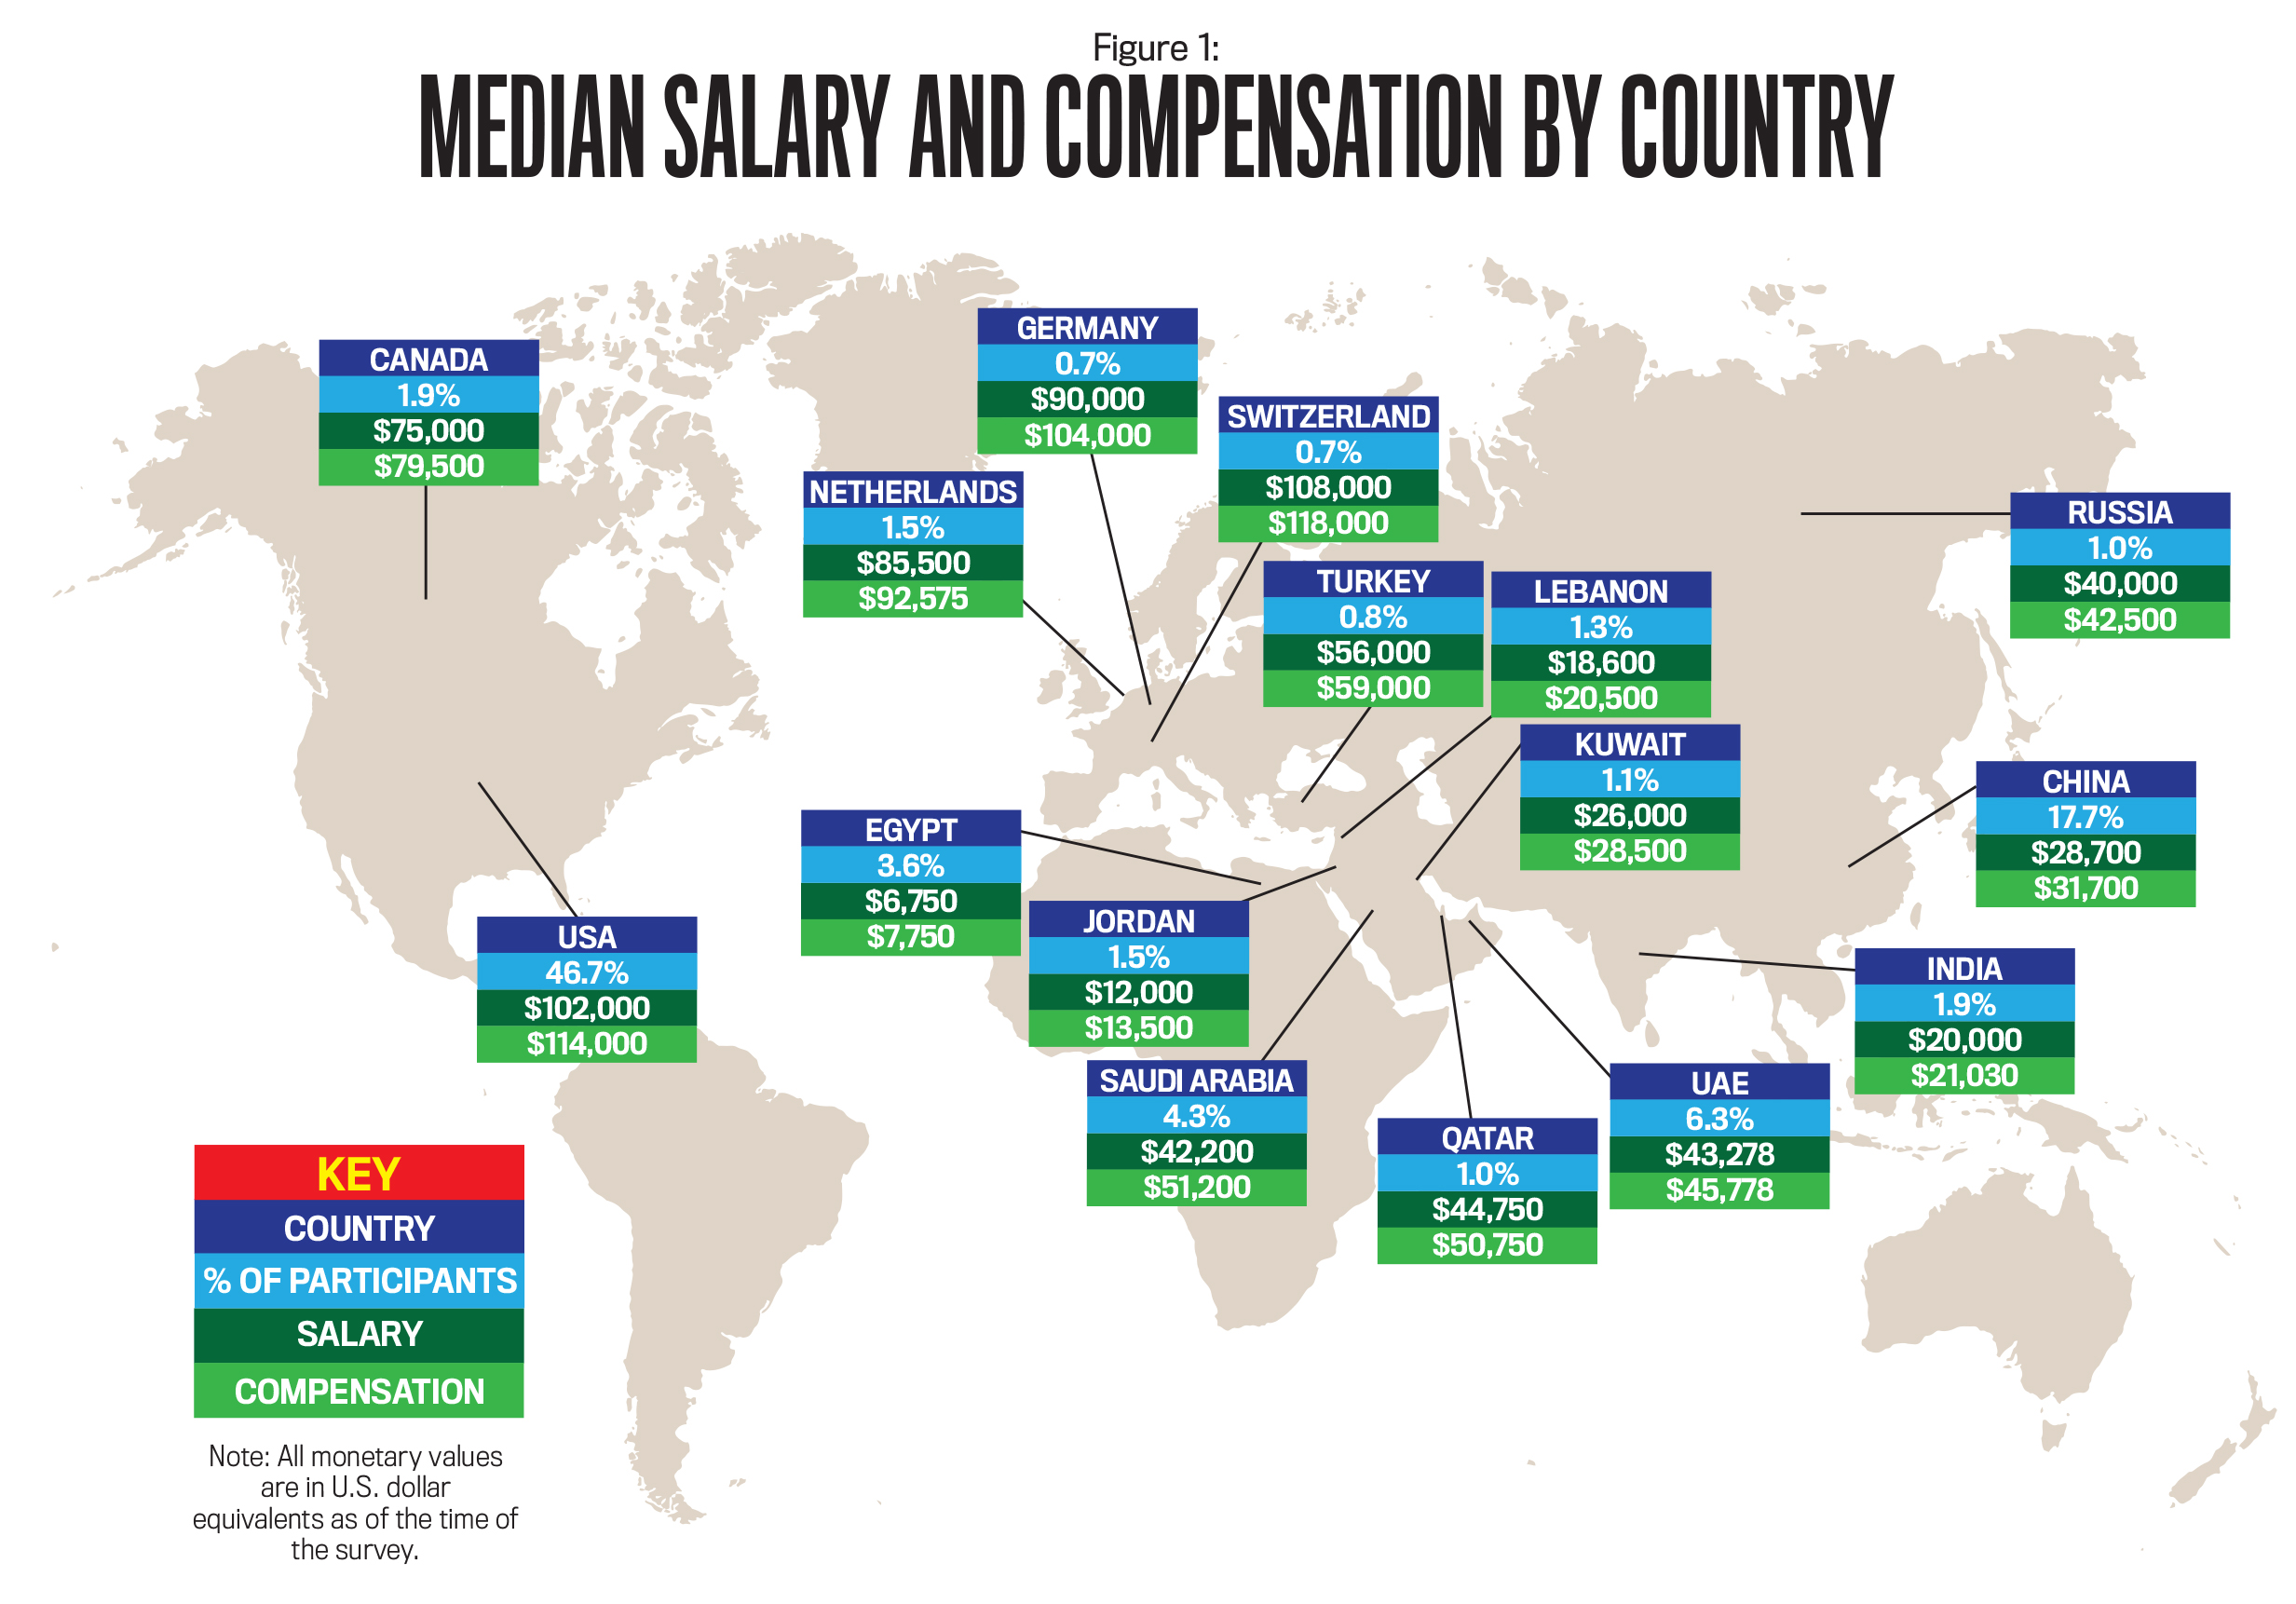
Table 1 presents specific characteristics of respondents from the regions of the Americas, Asia, Europe, and Middle East/Africa. Male respondents were more common in all regions, although women from Asian countries accounted for 46% of the total respondents in that region.
Consistent with prior years, almost all respondents have at least a baccalaureate degree (98% overall). Once again, Europe has the highest percentages of respondents holding advanced degrees (75%) and the CMA® (Certified Management Accountant) certification (65%), followed by the Americas. The overall percentage of respondents holding the CMA is up from 53% last year to 55% this year.
As in past years, respondents from Asia and Middle East/Africa tend to be younger than respondents from other regions. Although respondents in Asia still hold comparatively fewer top and senior-level management positions, the percentage increased from 19% last year to 24% this year. The percentage of respondents in that region with advanced degrees also increased, going from 31% to 33%.
Finally, respondents from the Americas continue to be about 10 years older than those in the other regions. As in the past, they also have the highest-ranking managerial positions, although Europe and Middle East/Africa respondents are close. More than one-third (36%) of all responding IMA members are top or senior leaders in their companies.
COMPENSATION
Table 2 lists the mean and median annual salary and total compensation for each major region and median change over last year. The global mean and median base salary are $79,278 and $68,675, up from $65,868 and $49,410 last year, respectively. Mean and median total compensation are also significantly higher than last year: $97,475 and $73,675 this year compared to $80,812 and $56,556 last year, respectively.
While these global salaries are significantly higher than those from last year, much of that can be attributed to the higher mix of respondents from the U.S. Within the individual regions, compensation was relatively stable compared to last year. Readers should be cautious about making comparisons of their salary to the global results and focus more on regional or country results.
As usual, there’s significant regional variation in compensation. Respondents from Europe and the Americas continue to report the highest compensation. The Americas and Asia were the only regions to have higher median base salary values over last year. The median base salary for the Americas increased from $98,217 in last year’s report to $99,700. Median total compensation for the Americas decreased slightly.
The median base salaries and total compensation values for Europe decreased 3% and 6%, respectively, from last year (see Table 2). The values vary significantly by country, as do the changes from last year. For instance, the compensation levels in Switzerland and the Netherlands are much lower than last year’s levels. Yet Switzerland continues to have the highest average salary and total compensation levels among all the countries represented in the survey. And while the German, Russian, and Turkish median base salary and total compensation values showed the largest increases over last year, compensation levels in Russia and Turkey are significantly below those of other countries in the region.
In the Middle East, median salary declined 6% from last year, and median total compensation declined 16%. On the positive side, a few countries in the region showed an increase in median base salary, including Egypt (3%), Saudi Arabia (17%), and Qatar (24%). Respondents in Egypt again received the lowest levels of median total compensation at $7,750, a 6% decrease from last year. With median total compensation of $51,200, Saudi Arabia again had the highest in the region, followed closely by Qatar’s $50,750—a 25% increase from last year.
Median compensation levels are up in Asia, driven by China’s increased median base salary (up 22%) and total compensation (up 6%). These increases may be driven in part by increased emphasis on management accounting and CMA in China.
GENDER PAY DIFFERENCES
Table 3 shows the median compensation by gender and age range. The salary gap—expressed as the percentage of women’s compensation in proportion to men’s compensation—has closed considerably from last year. For all ages, the gap is 89% in median base salary and 84% in total compensation, a sizable improvement over the respective 71% and 73% from last year—though at least part of this increase is due to the higher mix of U.S. respondents and lower mix of Asian respondents in this year’s survey.
The improved results were especially evident in the 20-29 age range, where the women had higher median values than the men. Women’s median base salary was 50% higher than the men’s, and their total compensation was 20% higher. In general, the salary gaps in the older age groups are slightly improved from last year. For instance, women’s median base salaries and total compensation are 92% and 84%, respectively, of the amounts paid to their male counterparts in the 30-39 age group, which is up from last year’s 81% and 83%.
Additional insight can be gained by looking at gender compensation by region and age (see Figure 2). In the Americas and Asia, women’s median total compensation as a percentage of men’s ranges from 72% to 92% and is highest in the 20-29 age group. Last year in Europe, women’s median total compensation was 90% of that of their male counterparts. This year, it’s only 70%, driven in large part by the 30-39 age group (57%).
Although the median compensation levels in the Middle East/Africa region are the lowest overall, median pay is generally higher for women than for men. In that region, the median total compensation for women ages 20-29 exceeds the median total compensation for men in that age group by 48%. The 30-39 and 40-49 age groups are also the highest of any region at 98% and 104%, respectively.
The biggest salary gap is in the Americas region in the 40-49 age group, where total compensation for women is only 72% of men’s total compensation. The promising news, however, is for the younger IMA members entering the management accounting field. Over the past few years, the gender pay gap has been small or nonexistent in the younger age brackets, and this year’s results continue that pattern.
CMA CERTIFICATION
Salaries of those holding the CMA continue to be significantly higher than those of non-CMAs (see Table 4). Globally, CMAs earn 45% more in median salary and 50% more in median total compensation than non-CMAs. This “CMA difference” varies by region. In the Americas, CMAs report 21% and 23% higher median salary and total compensation, respectively, than non-CMAs. In the Middle East/Africa region, the difference is 75% and 90%, respectively. These results suggest that many individuals who have earned the CMA are reaping the rewards of their effort and dedication to professional development. An accounting manager in Kuwait wrote that the CMA is “a prestigious certification which gives you higher status and revenue and empowers you with the latest skills and tools required for a finance professional to excel in the present competitive market.”
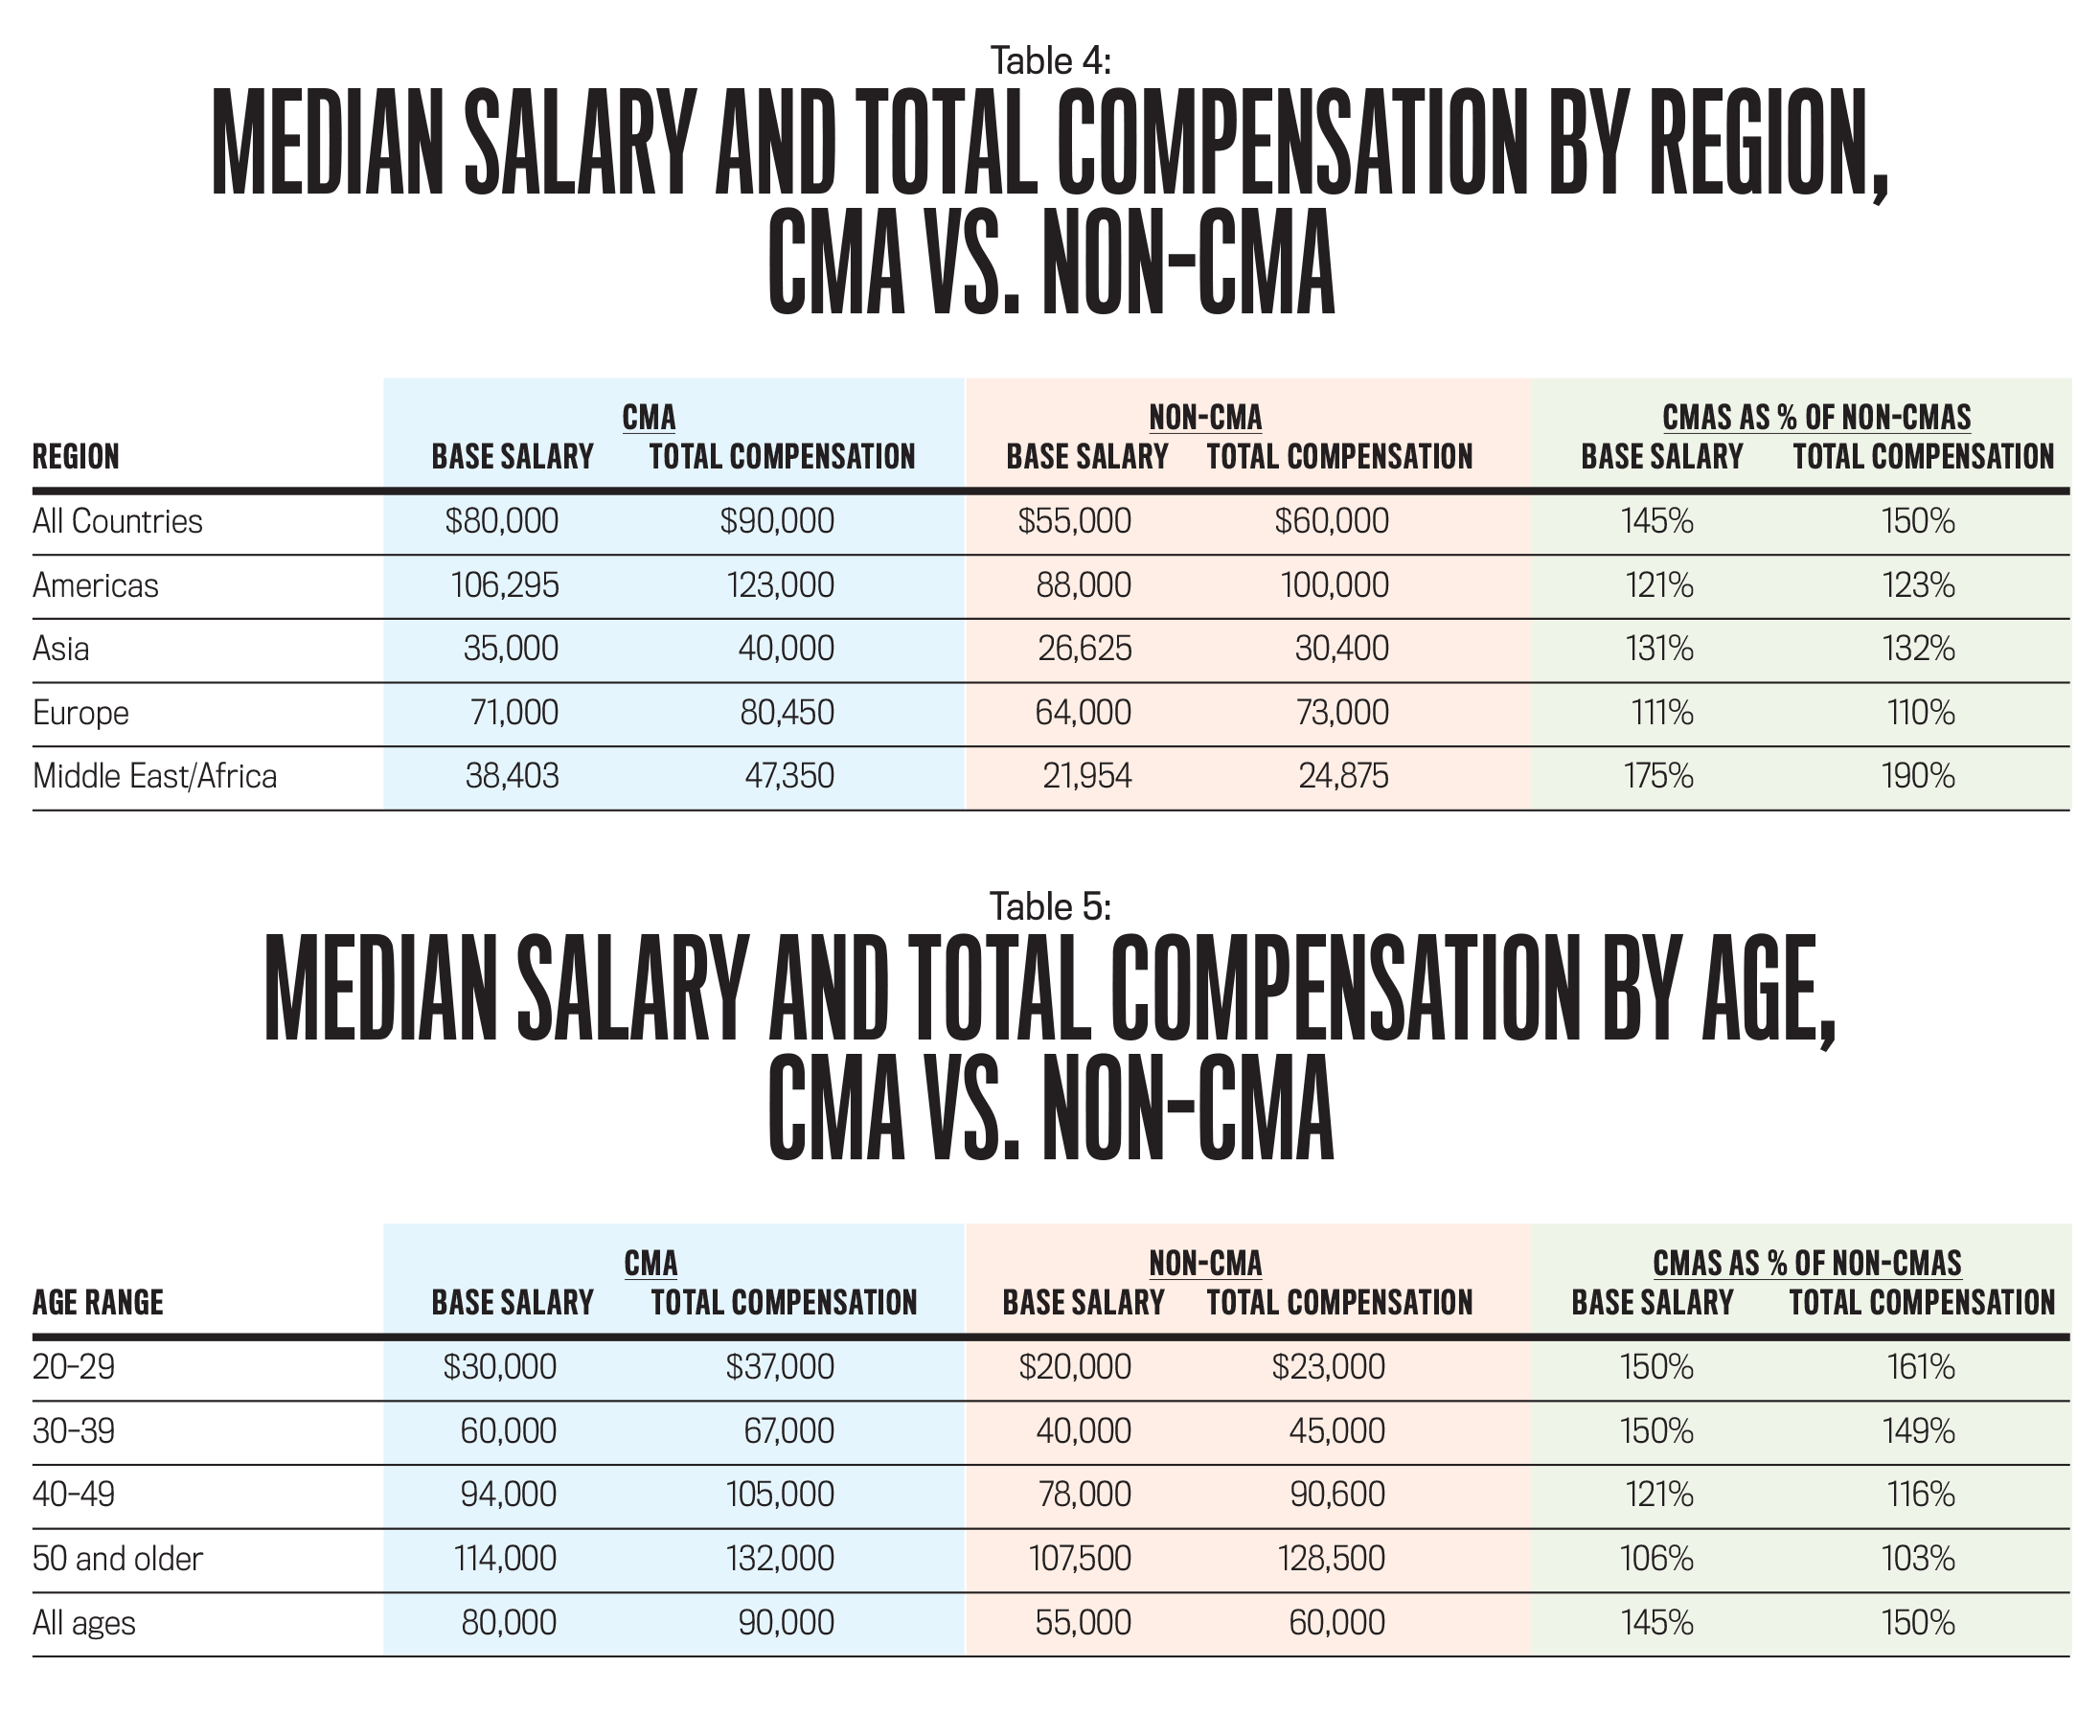
Table 5 compares the median salary and total compensation of CMAs and non-CMAs by age group. In every age group, CMAs report higher compensation levels. CMAs ages 20-29 show an impressive 50% and 61% compensation difference. Those in their 30s have 50% and 49% higher median base salary and total compensation, respectively. A female 37-year-old project cost accountant in Abu Dhabi noted, “CMA certification gives me an edge over other candidates when applying for a position and also to negotiate my salary.”
Of course, a number of other factors affect the CMA salary difference in addition to having the certification. Being ambitious, disciplined, smart, and motivated had a lot to do with earning certifications, advanced degrees, and higher management levels—all of which can impact compensation. Overall, CMAs also tend to be a little older, have more years in the field, are at higher management levels, and are more likely to have a graduate degree.
Yet even after considering these other factors, having a CMA is still statistically significantly associated with higher compensation. As one U.S. respondent from Michigan commented, “When I first obtained my CMA, I received a raise much higher in value than those of the rest of the firm.”
These results indicate the value of the CMA credential, which recipients earn through relevant work experience, passing a rigorous two-part exam, and ongoing continuing education. CMAs have demonstrated their mastery of the critical accounting and financial management skills needed on the job today. A 41-year-old division manager for a U.S. engineering consulting company said, “The biggest value I’ve received from the CMA is to stretch my thinking and dive deeper in some of the study material I used to apply these principles at work. I’ve been doing that these past three months since I took the exam. If I’m effective at providing helpful information and making insightful recommendations, that will be the biggest value to my employer of my certification.”
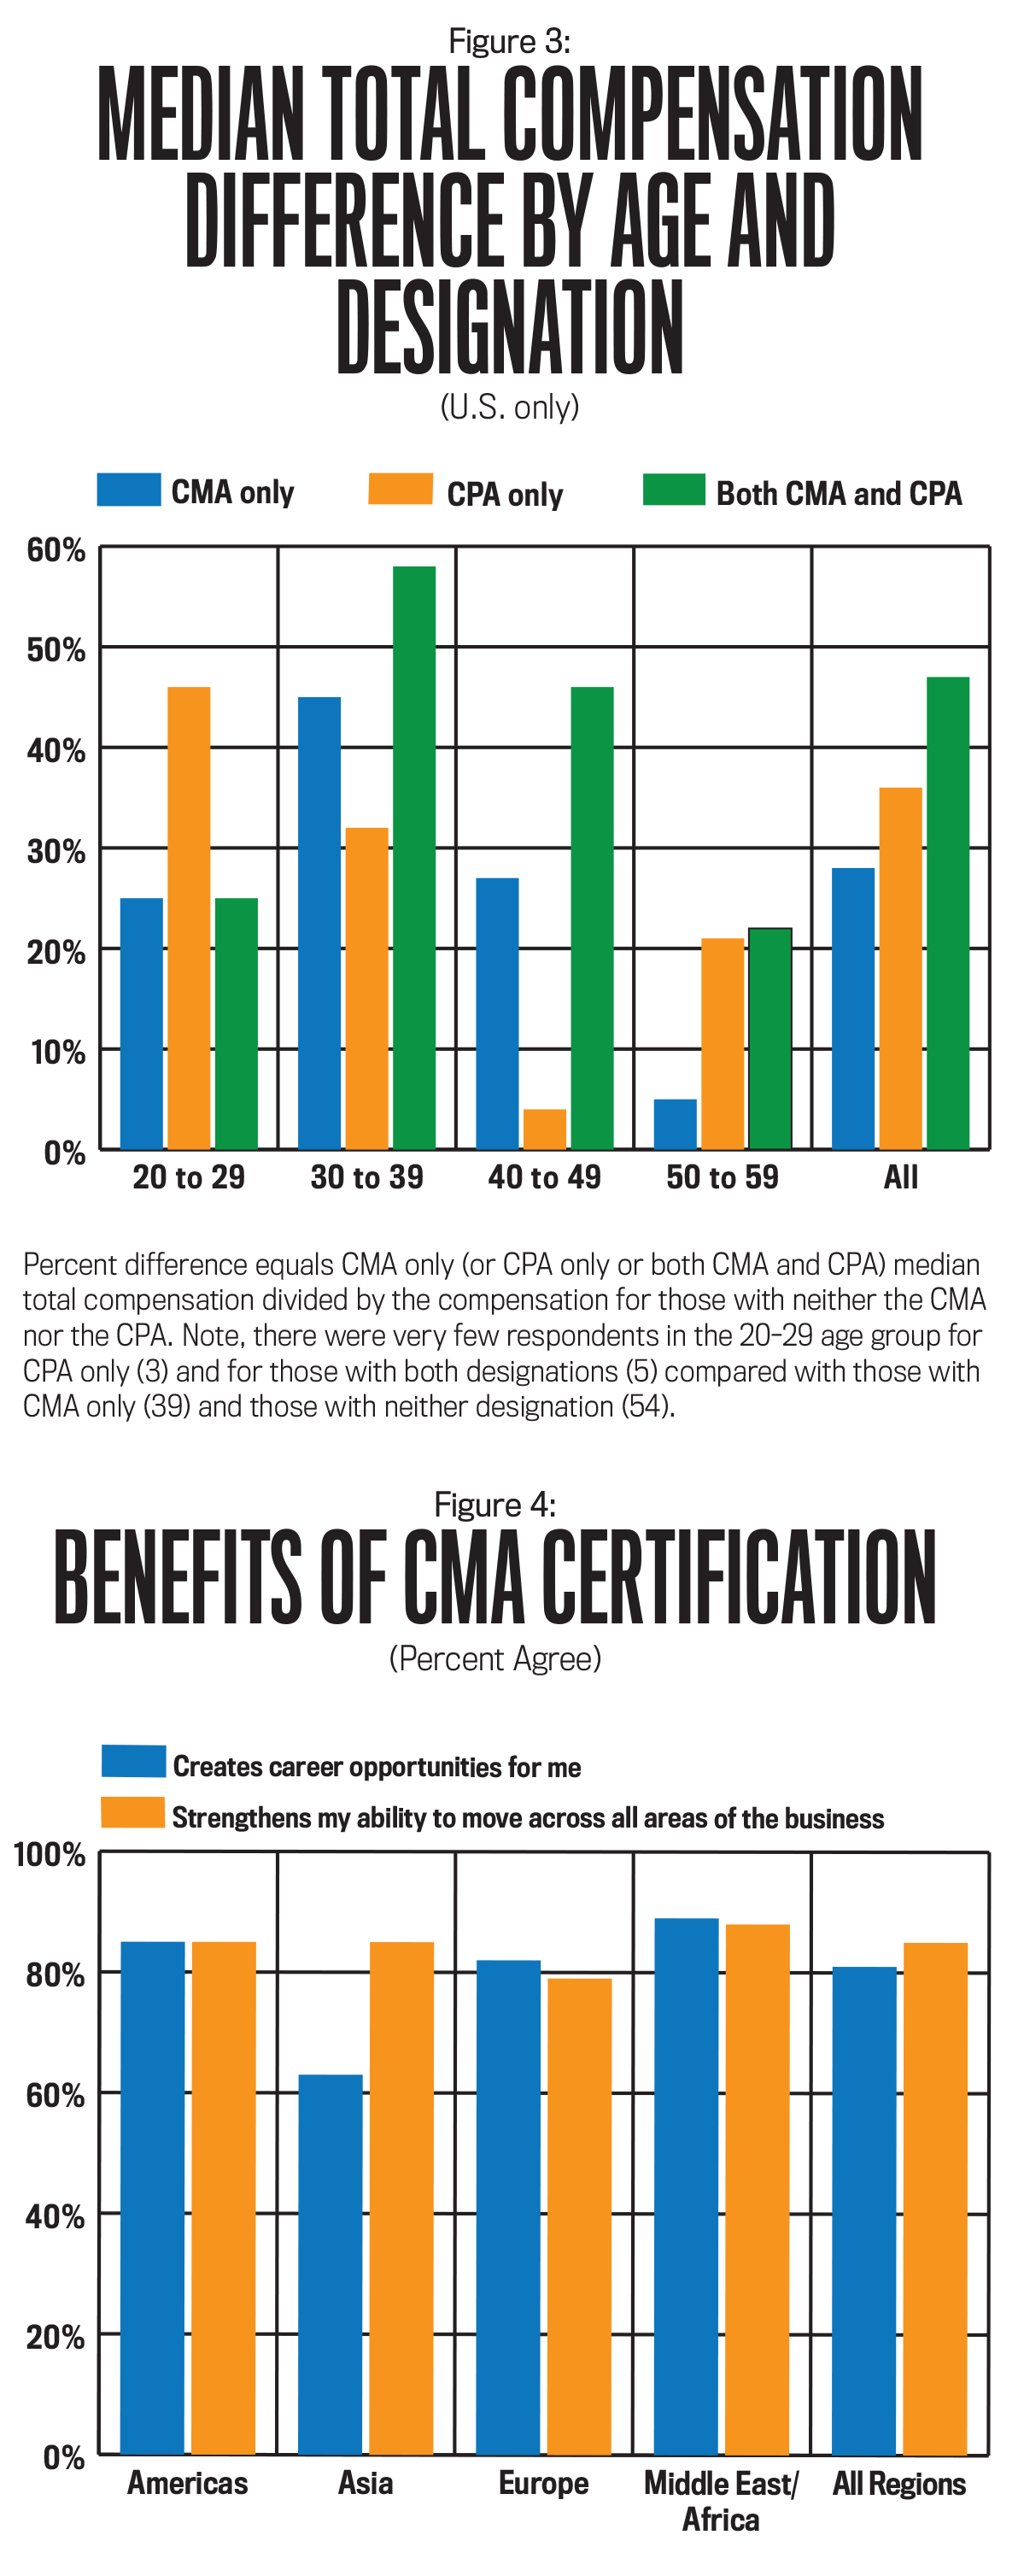
In the U.S., 57% of the respondents hold the CMA certification, 27% hold the CPA certification, and 18% have both. Across all age groups, these groups reported higher median total compensation than those with no CMA or CPA (see Figure 3). Overall, those holding only the CMA report 28% higher median total compensation than those with neither certification, while those with only a CPA report 36% higher median total compensation. Those with both the CMA and CPA certifications, who should presumably have a wider range of skills, report a median total compensation 47% higher than those with neither. And those with both the CMA and CPA certifications report higher median compensation in three of the four age groups and overall.
In the 20-29 age group, survey respondents who hold the CMA have 25% higher median total compensation than those with neither certification. There were too few respondents in the 20-29 age group for those with CPA only (3) and for those with both certifications (5) to make meaningful comparisons. For those ages 30-39, CMAs report 45% higher compensation than noncertified individuals, and those with both the CMA and CPA earn 58% more.
THE VALUE OF THE CMA
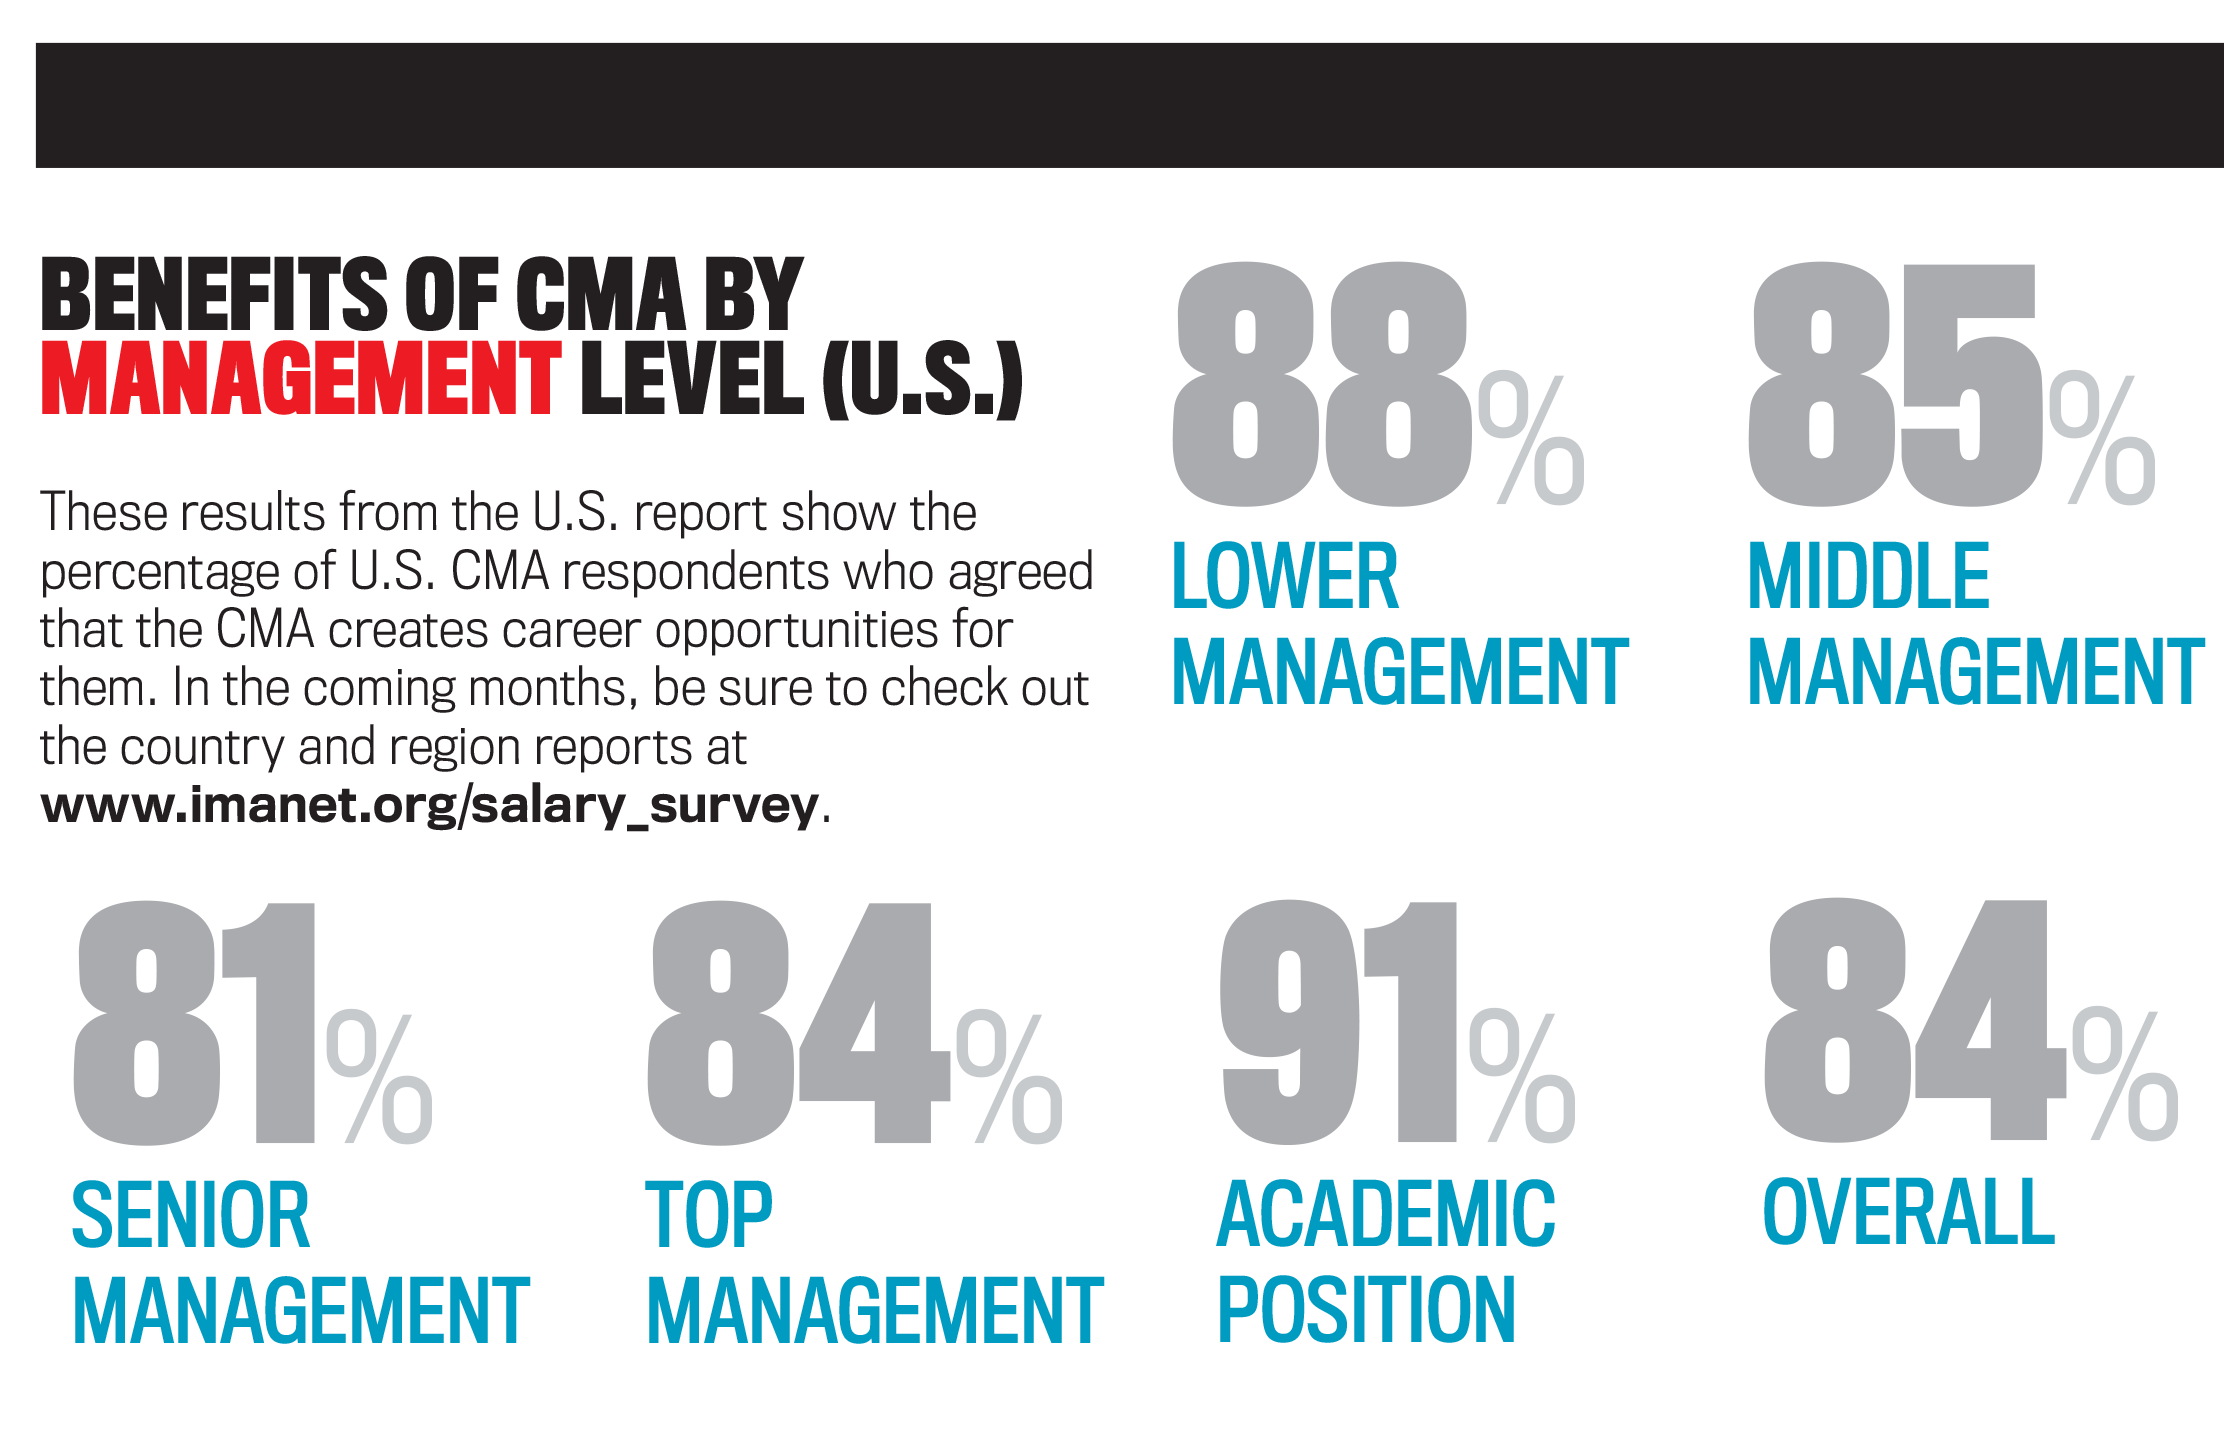
As found in previous salary surveys, 80% or more of CMAs across all regions feel that their certification enhances their ability to move across areas of the business (see Figure 4). This value is also recognized by the 871 respondents currently pursuing a CMA credential. When asked the primary reason for pursuing the credential, more than 80% said “career advancement.”
CMAs also largely agree that their certification creates career opportunities (see Figure 4). A 35-year-old corporate controller in Germany said his CMA “allowed me to enter into the specialist career at my company, indicating management accounting knowledge.” A 28-year-old senior accountant in the U.S. commented, “At my workplace, CMA certification has become ‘the cost of doing business’ to advance within the accounting function.”
EDUCATION
Previous salary surveys have consistently shown the value of education: Nearly all participants (98%) have at least a baccalaureate degree, and 46% have an advanced degree. While a baccalaureate appears almost necessary, is an advanced degree worthwhile? Table 6 illustrates that, for 2016, median total compensation values increase with advanced degrees in all but the Europe region. One reason for the exception may be that 75% of all European respondents have advanced degrees, which means that, in that region, there are relatively fewer respondents who don’t have a graduate degree.
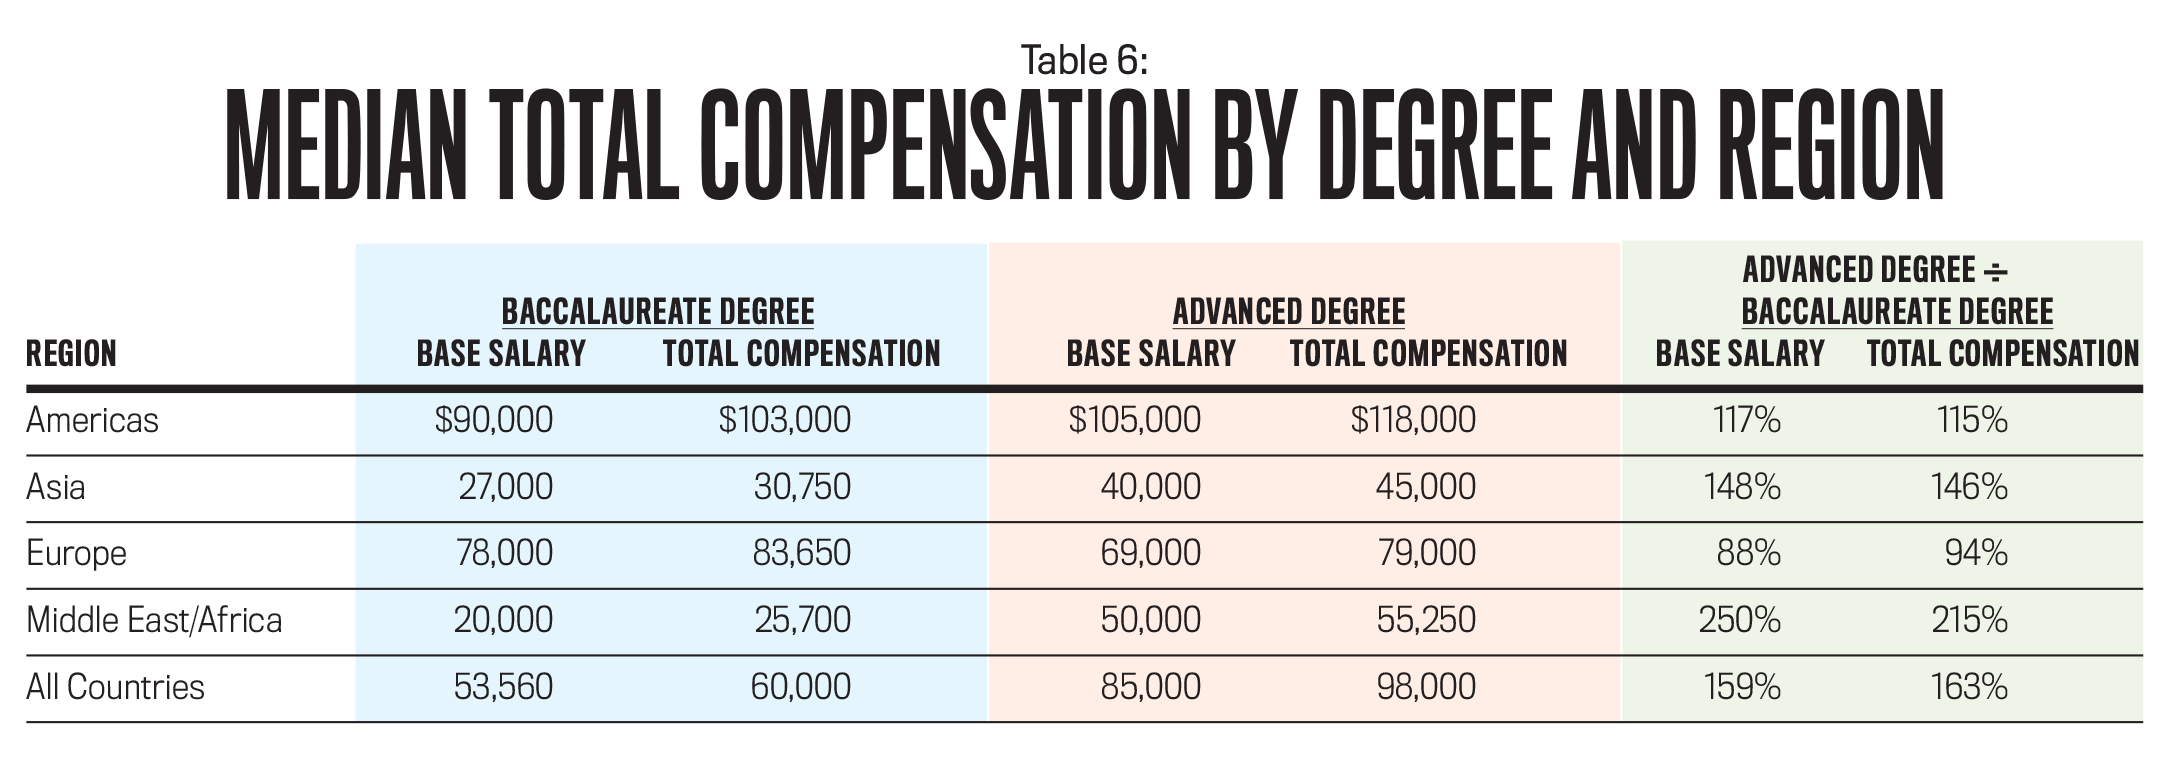
Mean compensation values also are higher for those with graduate degrees by 4% to 10%. Clearly, education remains a very strong contributor to pay levels. Each academic level increase represents an increase in median total compensation by 15% for those in the Americas, 46% for those in Asia, and a whopping 115% in the Middle East/Africa. Further, those with doctoral degrees report a 41% increase in overall median total compensation compared to those with a master’s degree.
MANAGEMENT LEVEL
Compensation varies considerably by management level. Overall, as shown in Figure 5, respondents in top management positions earn median total compensation of $140,000, compared to $105,138 for senior management, $67,500 for middle management, and $50,718 for lower management.
As with other factors, the results vary considerably by region. For example, the median total compensation for those in top management in the Americas is $165,000, followed by $85,000 in Europe, $66,000 in Asia, and $34,000 in the Middle East/Africa region.
JOB SATISFACTION
Besides compensation, respondents were asked to assess their overall job satisfaction with different attributes related to their job (see Table 7). More than half of the respondents overall (56%) expressed some level of satisfaction with their job. Respondents were most satisfied with their working relationships with others (74%), work-life balance (73%), job security (58%), the opportunity to do interesting and challenging work (57%), and the way their employer handles ethical issues (57%). At the other end, they were least satisfied with:
- Salary (49%),
- How their supervisor includes them in the decision-making process (47%), and
- Opportunity for advancement (30%).
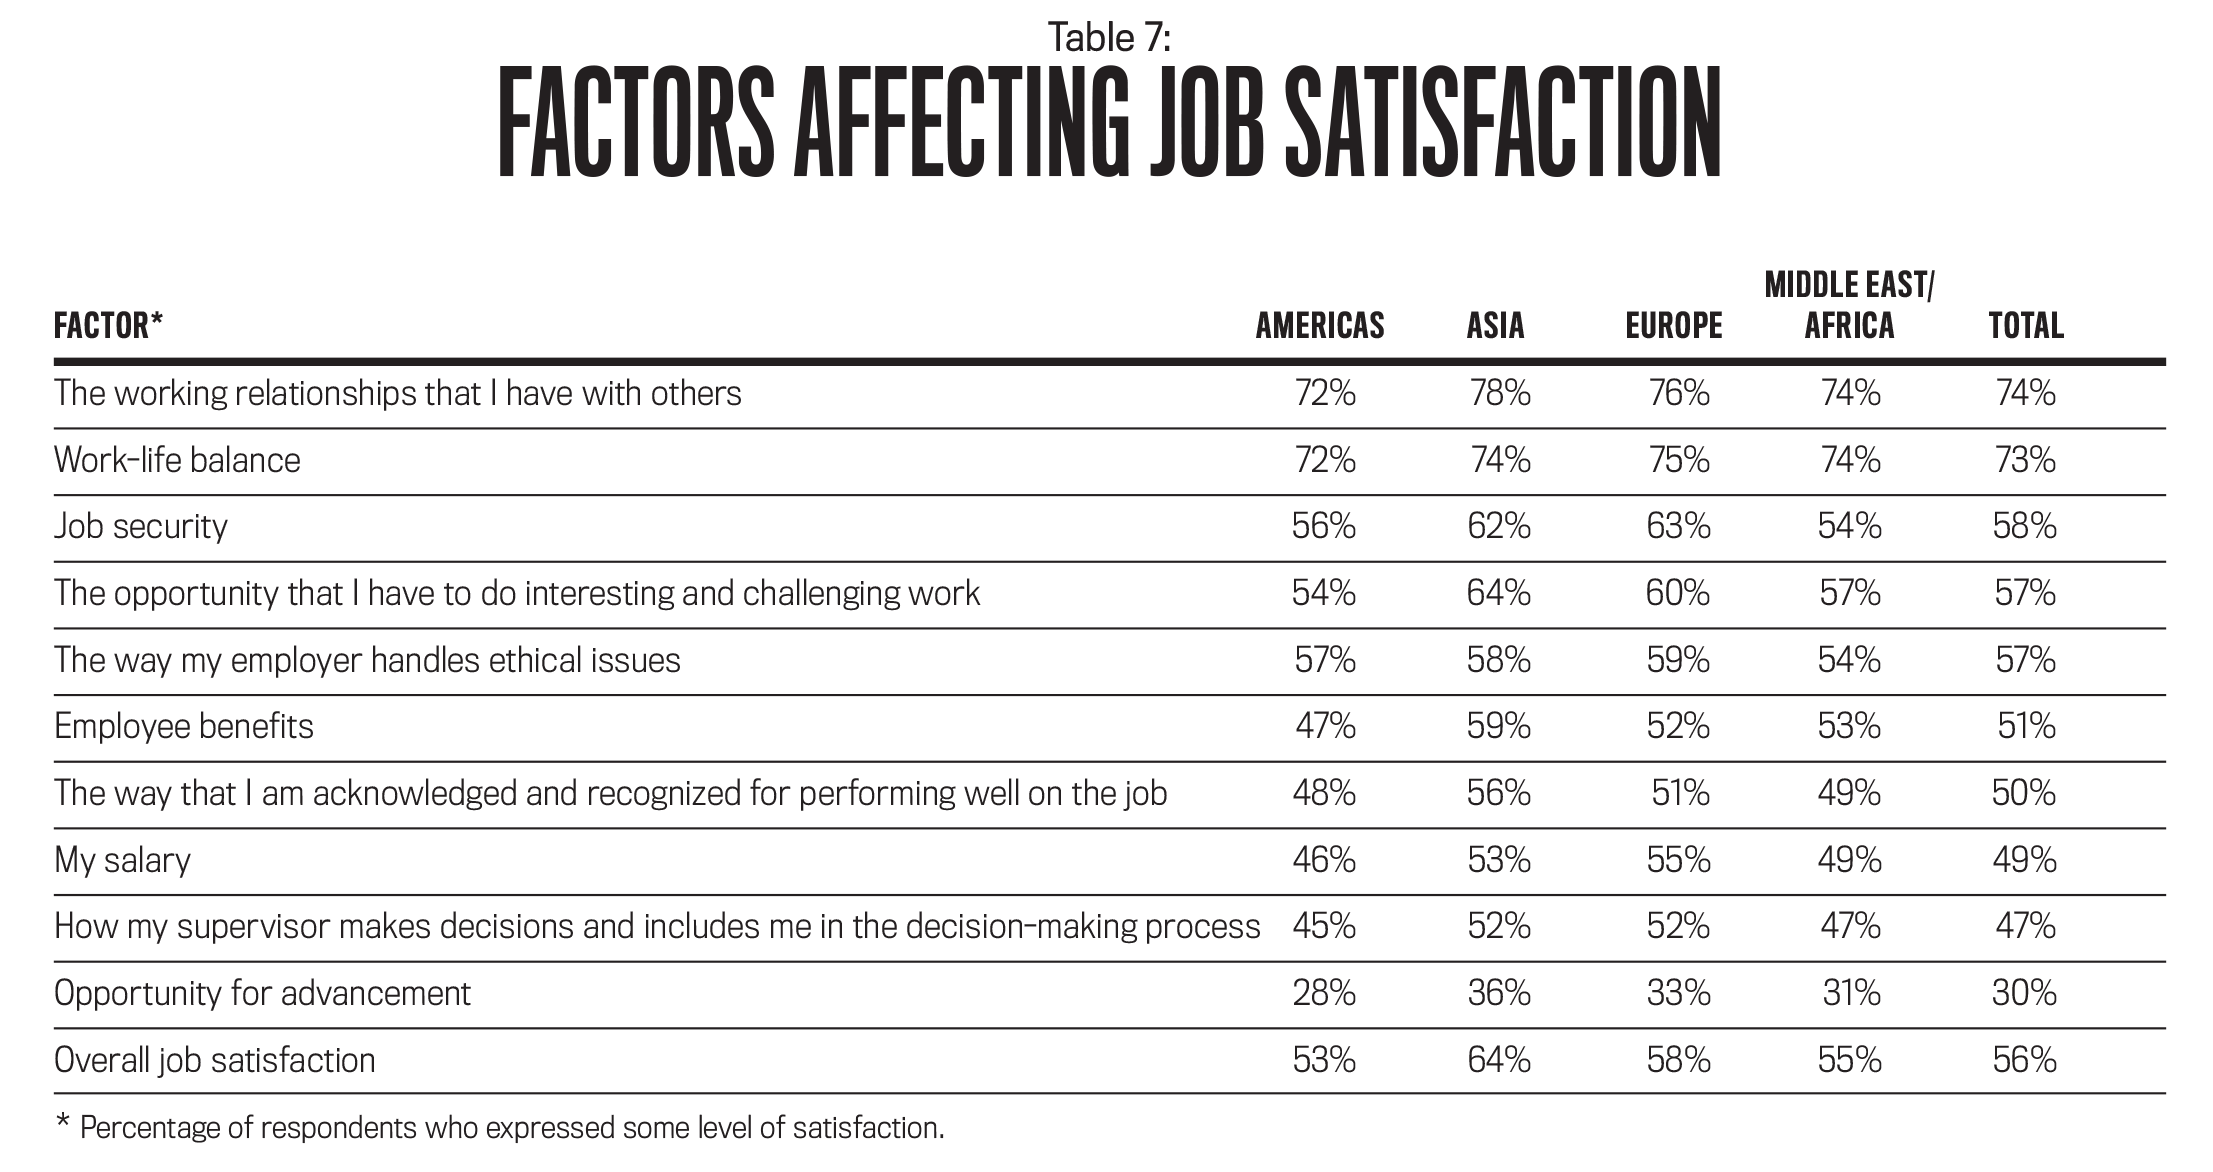
There are a few noticeable differences among the regions. Those in the Americas tended to be a little less satisfied with all aspects of their job, perhaps due to a higher standard of living and higher expectations than in other parts of the world. Those in Asia and Europe tended to be a little more satisfied with their job.
Although these results provide overall trends, each individual has his or her own unique needs and talents. Here are some individuals’ comments about their concerns and the factors contributing to their own job satisfaction:
- “A career in education is rewarding, challenging, and a great work-life balance.”—a professor in China
- “Aiding the decision-making process, being a business partner, and being recognized as an established leader has assisted my advancement and increases in salary.”—a 33-year-old staff accountant in China
- “Getting appreciation from your direct manager and the owner is important to improve yourself and to reach to higher level of ethics.”—a U.S. corporate controller
- “As CFO, an important part of my compensation is long-term compensation—it is the biggest value component of my package. It is also ‘at risk,’ so not always realized. Vesting schedules matter, and ultimately input into decision making that determines the success or poor performance of the company is very important. I have value at risk and want to do what I can to assure its realization.”—a 46-year-old division VP in China
RAISES
Approximately 70% of respondents overall received a pay raise within the past year. The percentage was a little higher in the Americas (75%) and a little lower in the Middle East/Africa region (56%). The median raise was 5%, which is down from last year (8%). Regionally, raises in the Asia and Middle East/Africa regions tended to be larger (with a median of 10%) than those in the Americas (3.4%) and Europe (5.5%), but they happen less frequently and are smaller in absolute dollar amounts.
The prospects for future raises appear to be fairly consistent among all the regions. About 76% of the survey respondents overall expect a pay raise in the coming year. It is highest in the Americas (80%) and lowest in Middle East/Africa (71%). The median expected raise in the coming year is 5%, which is down from last year’s 8%. For the regions, the expected percentage raises—Americas (3%), Asia (10%), Europe (5%), and Middle East/Asia (10%)—are about the same as the raises received in the past year.
HOURS WORKED
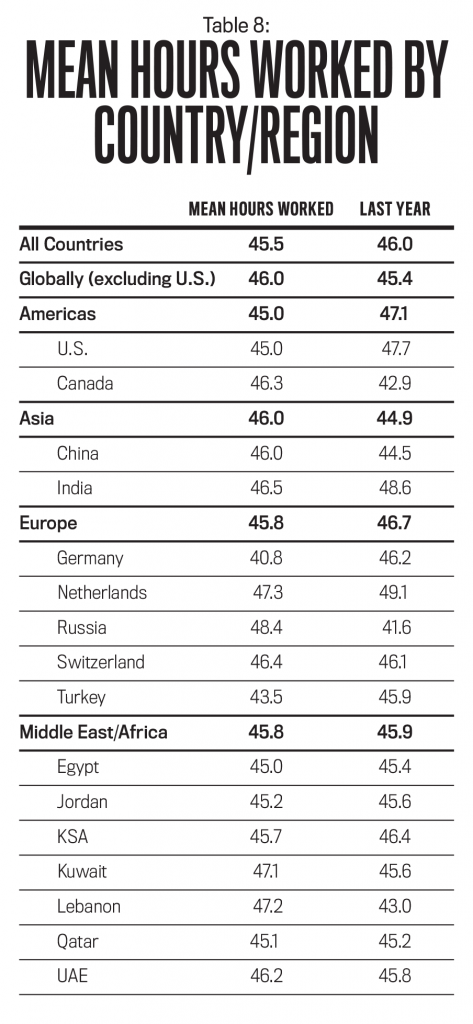
As shown in Table 8, survey respondents worked an average of 45.5 hours per week, which is a little less than reported last year (46). Russian respondents reported the longest work week at 48.4 hours, up from lowest last year of 41.6 hours. Next were the Netherlands (47.3) and Lebanon (47.2). The countries with the lowest reported work week were Germany (40.8 hours, down from 46.2 last year), Turkey (43.5), and the U.S. (45). None of the countries listed in Figure 1 reported an average of less than 40 hours of work per week.
THINGS ARE LOOKING UP
With overall higher median salaries and total compensation compared to last year, there are reasons for IMA members to feel optimistic about the future. Salaries were up in the Americas and Asia and only slightly lower in Europe and the Middle East/Africa region. Further, more than three-fourths of survey respondents expect to receive a raise this year. The salary gap continues to show promising developments in the younger age ranges. Female respondents in their 20s reported higher median compensation than the male respondents. But there is still work to be done in older age groups.
The value of CMA certification remains strong around the world. CMAs report substantially higher salaries and total compensation than their non-CMA counterparts. This salary difference, along with the greater career opportunities available to CMAs, attests to the ongoing value of this program. In the U.S., the optimum benefit is achieved by earning both the CMA and the CPA certifications.
We sincerely appreciate members’ willingness to share their time and data with us. For that, we are truly grateful. Your continued support is essential as we strive to increase the value and relevance of the salary survey for IMA members.
March 2017

