CHARACTER STANDARDS
What is a character? It can be a letter of the alphabet, number, punctuation mark, space, or special character that you find on a typical keyboard, such as $, @, and %. It can also be one of a large number of symbols, including foreign letters and emoticons.
Each character is assigned a unique number as defined by various standards. In the 1960s, the American Standards Association (ASA), which later changed its name to the American National Standards Institute (ANSI), created a seven-bit standard code to represent and store text data called the American Standard Code for Information Interchange (ASCII), mapping numbers to 128 common characters. For example, in the ASCII standard, the letter “A” is given the value of 65. You can see this on a PC by holding down the ALT key while typing 65 on the numeric keypad. This sends the ASCII decimal sequence for the character A to the computer, telling it to display the character A on the screen.
While ASCII was adopted by most of the computer manufacturers, IBM used its proprietary six-bit BCDIC (Binary Coded Decimal Interchange Code). As time went on, Extended ASCII (EASCII, or high ASCII) was defined with eight bits, and IBM created its own eight-bit EBCDIC (Extended Binary Coded Decimal Interchange Code).
Transferring data between different systems was tricky because the values for characters were different, and the codes didn’t all contain the same characters. Learning from the benefits and bungles of the early standards, the International Organization for Standardization (ISO) built new standards to define more points to facilitating uniformity and supporting more languages. The result is ISO/IEC 10646, commonly known as the Unification Code, or Unicode for short.
UNICODE
The Unicode standard defines characters written in all major modern and historic languages, as well as symbols from collections such as box and line drawings, math, music, arrows, games, currency, dingbats, emoji, astrology, astronomy, and chemistry. The most common way to store Unicode can represent most of what is currently defined using one to four (eight-bit) bytes for each character.
The numeric code for each character is given in both decimal and hexadecimal notation. Decimal values have 10 possibilities for each place, using the digits 0 through 9. Hexadecimal codes have 16 options for each place using the 10 digits and the first six letters of the alphabet, A through F.
Unicode also has 17 planes, each of which contain up to 65,536 characters. Planes can be divided into blocks such as Basic Latin, Cherokee, Greek, Box Drawing, Block Elements, and Geometric Shapes. Blocks can contain 16 to 65,536 code points. More than 30,000 code points are assigned on 273 blocks, with room for many more. Using this rich set of characters, it’s possible to display graphics in Access using queries.
To store characters, various encoding methods are used such as Unicode transformation formats (UTF), including UTF‑8 and UTF‑16. UTF‑8 is common and maximizes compatibility with ASCII. The number of bytes to store each character varies; only one byte is used for ASCII characters in the first 128 code points (commonly used), and then whatever is needed up to four bytes is used for other characters. UTF-8 can represent the majority of defined symbols, but it can’t show all characters in all Unicode planes.
Some fonts have more, and better, Unicode representations than others. For Windows standard built-in fonts, Arial Unicode MS and Lucida Sans Unicode have fair coverage. Common fonts such as Arial, times New Roman, and Calibri are okay, too.
BUILD A GRAPH
Let’s build a small bar graph. Assume we’re starting with a table, MyData, that contains a descriptive text field (Category) and a currency field (MyValue). Create a new query using MyData as the source. Add the Category and MyValue fields to the query grid. In the third field, define a calculated field to show a graph by entering TheGraph: String( CInt( MyData.MyValue) ,ChrW(9600)).
This uses the String function, which repeats any specified character a defined number of times. The first parameter for String is the number of repetitions. In our function, that’s calculated from MyValue. That’s contained within the CInt function, which is short for “convert to integer.” That’s needed to round values in MyValue to whole numbers. This is necessary because you can’t display half or quarter characters.
The second parameter for String is the character to repeat. ChrW(9600) returns the Unicode character corresponding to the value of 9600, which is the upper half block character (▀) Thus, this field displays one block character for every whole number in the corresponding MyValue field, creating a simple bar graph.
In the Format property of the field, you can specify a color by entering a command using [Color]@ syntax. Within the brackets, you can enter your choice of color: Black, Blue, Green, Cyan, Red, Magenta, Yellow, or White. The @ symbol signifies that the column value should be treated as text (as opposed to a number). Figure 1 shows the Design view of the query and column properties with format set to [Blue]@. Figure 2 shows the results of the query in DataSheet view. As you can see, the graph bars are blue. When in DataSheet view, make sure the column width of TheGraph is wide enough so that all the bars are fully displayed.
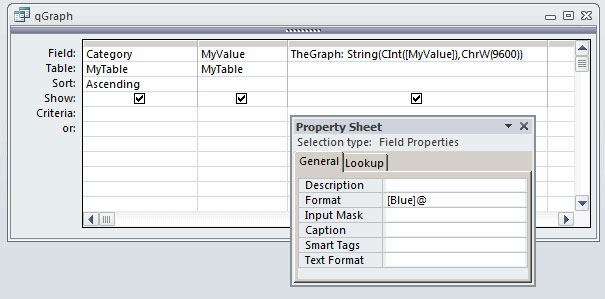 Figure 1
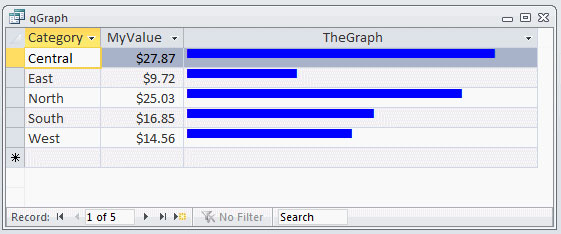 Figure 2
ONLINE EXCLUSIVE
Download this month’s database: sf-1707-GraphsInQueryUsingUnicode. In addition to the sample data used in the column, the download database has a table with a few of the numerous Unicode symbols you might want to use for visually displaying information, as shown in Figure 3.
 Figure 3
The database also contains a number of other queries using various symbols and colors, like in Figure 4.
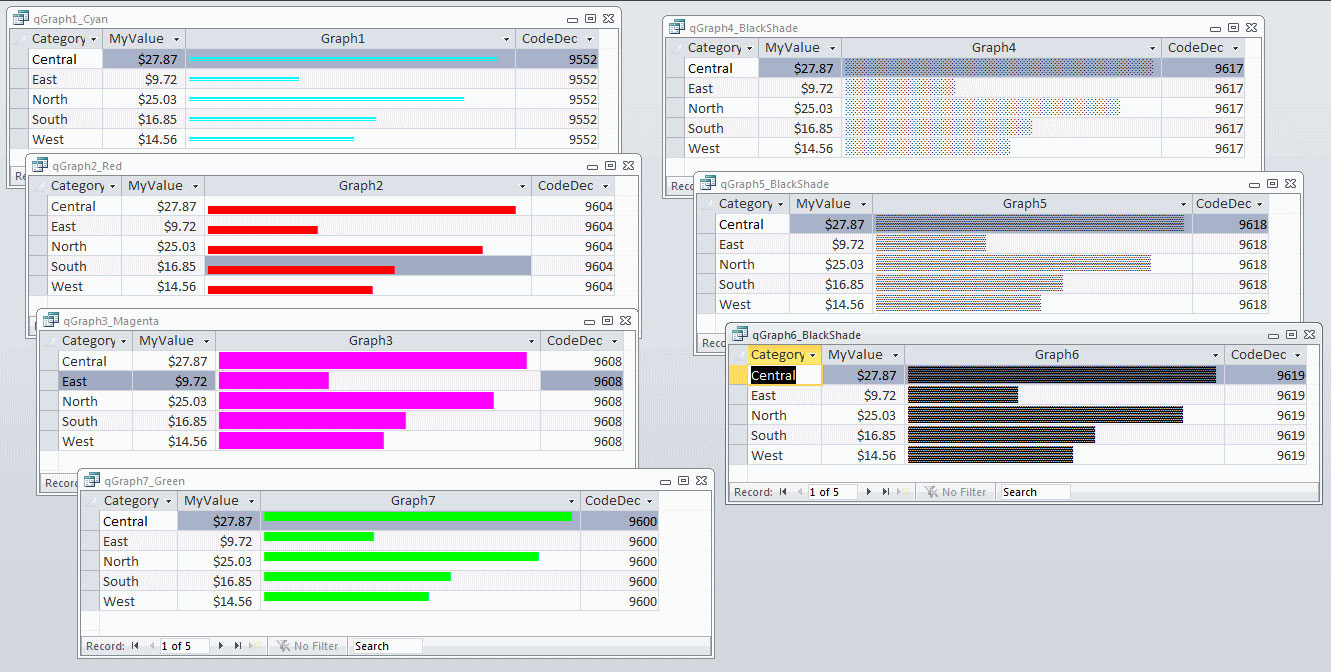 Figure 4
On a form or report, you can set the font and background color for controls and choose from a much bigger palette of colors than the limited number of color names used in the Format property.
Visualizing numbers using symbols like this is a great way to show relative differences.
SF SAYS
Add visual fireworks to your data using calculated fields to create graphs composed of block characters.

July 2017

