DATA FOR THE REPORT
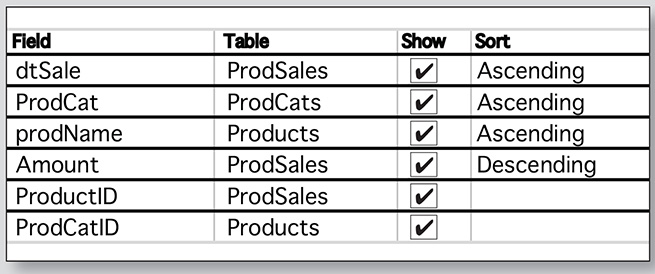
The report we want to build will include subtotals for sales by product category each day and then sum all sales by day, month, and year. First, create a new query to assemble the data that will be on the report. Add the ProdSales, Products, and ProdCats tables as the data sources. Figure 1 shows the fields (and their settings) to include in the query design. Save this query as “qSales.”

ProductID and ProdCatID are included because we’ll need them later when we implement criteria to filter the report for just a product or product category.
REPORT WIZARD
With the qSales query selected in the Navigation Pane, select the Report Wizard from the Create ribbon tab. When Report Wizard appears, qSales will already be chosen in Tables/Queries. (If it isn’t, use the dropdown menu to select it.) Move all available fields to the Selected Fields box and click Next. Choose “by ProdSales” for “How do you want to view your data?” Click Next.
Double-click dtSale three times to add three grouping levels for the date (year, month, day). Then double-click ProdCat for the fourth level. The wizard is limited to four levels of grouping, but more can be added later. Click the Grouping Options button in the lower left. Set the grouping interval to “Year” for the first dtSale level, “Month” for the second level, and “Day” for the third level. ProdCat will be “Normal.” Click OK, then Next.
For the Sort order, choose “prodName” set to Ascending order and then “Amount” set to Descending order. Click the Summary Options button to specify what summary values you would like calculated. For the Amount field, check the Sum box. Click OK and then Next. Set the layout to “Outline,” then click Next. Enter “Product Sales” as the title. Click Finish.
MODIFY THE DESIGN
When you complete the wizard, Access opens a preview of your report. It isn’t very pretty, and the columns likely won’t be wide enough to show the actual data. For example, the report will display ### in the Amount column rather than the actual values. There are other issues that should be changed as well: The ID fields should be hidden. The date doesn’t need to appear in the detail because it’s already displayed in a group. There’s extra space that can be closed up. The report title only shows on the first page.
Change to Design view to make changes. The report title is much bigger than it needs to be. Select its control. In the Property Sheet, change the font size to 12 and the color to black. Double-click on one of the control resizing handles to best-fit.
Make the Page Header section bigger: Place the mouse pointer along its lower boundary. It will turn into a horizontal line with a double-headed vertical arrow. Click and drag the mouse down.
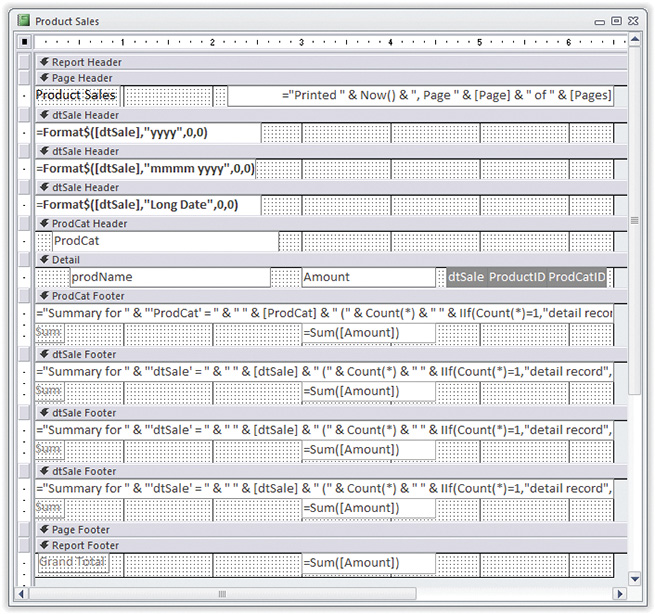
Move the “Product Sales” title from the Report Header into the upper-left corner of the Page Header area. Find the control with the page number equation in the Page Footer. Move that control to the upper-right of the Page Header: Using the ruler displayed along the top of the Design view, align the right edge of page number control so that it’s at 6.5". On the Property Sheet, change the Control Source to ="Printed " & Now() & ", Page " & [Page] & " of " & [Pages]. Delete the other control in the Page Footer.
In each of the dtSale Header sections, delete the labels and rectangle control. Move the textbox controls up and to the left, and bold their text.
Delete all the labels in the ProdCat header. Select the ProdCat control. Set its Top property to 0 and its Left property to 0.2". Bold the text.
Select all the controls in the Detail section and set their Top to 0. For the ProdName control, set its Left property to 0.4". For the ProductID, ProdCatID, and dtSale controls, set their Visible property to No, Back Color as dark gray, and Font Color as white.
For the Amount control, set the Left property to 3" and Width to 1.5". Repeat for any controls in the group footers that sum the Amount.
For the other controls in the group footers, best-fit each of the summary controls, set their Shape Outline to Transparent, and move them far enough left so that no control extends past 6.5" on the ruler. Finally, close up each section to remove any extra space, then drag the right boundary of the design to 6.5". Save the report. Your design should look similar to Figure 2. Download this month’s database: sf_oct_2016_simplegroupedreport.

Next month, we’ll modify this report a bit more, rename it, and add it to the menu.

October 2016


