CONSOLIDATING SUBTOTAL LINES
When looking at the Product Sales report in Report view, you’ll see that each of the group footer sections in the report contains textbox controls that provide a summary of the number of records in that product category group, for example, “Summary for ‘ProdCat’ = Brass (4 detail records).” The line below it provides the total sum sales for that group. Space could be saved if the descriptive information was combined with the sum line and if extra words were deleted.
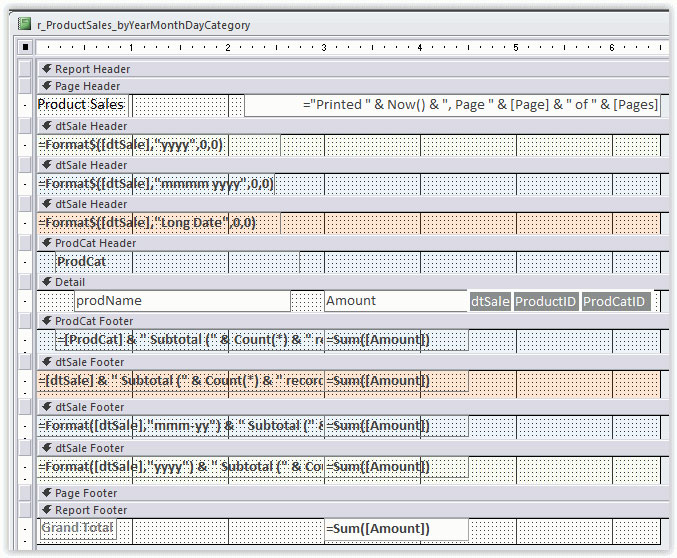
Go to the Design view. In the ProdCat footer, select the textbox control with the descriptive information and change the control source of the textbox control to: =[ProdCat] & "Subtotal (" & Count(*) & " record" & IIf(Count(*)=1,"","s") & ")". Now the summary and total can be combined into one subtotal line, with text that will say, for example, “Brass Subtotal (4 records)” and the numerical total for that group.
Next, change the three date-related footers to list the total number of records and numerical sum of sales for that period. The first dtSale Footer is the sum by day. Change its descriptive equation to: =[dtSale] & " Subtotal (" & Count(*) & " record" & IIf(Count(*)=1,"","s") & ")".
That’s followed by the group footer section for the sum by month (the second dtSale Footer). Change its descriptive equation to: =Format([dtSale],"mmm-yy") & " Subtotal (" & Count(*) & " record" & IIf(Count(*)=1,"","s") & ")".
Finally, there’s the group footer section for the sum by year (the third dtSale Footer). Change its descriptive equation to: =Format([dtSale],"yyyy") & " Subtotal (" & Count(*) & " record" & IIf(Count(*)=1,"","s") & ")".
ADDITIONAL CLEANUP
The product category is indented in the ProdCat header. To match that indent in the ProdCat footer, click on the textbox in the footer and open the Property Sheet. Set its Left property to 0.2" and its Width to 2.8". That way, it won’t overlap the Amount control, which is placed at 3".
In each of these group footer sections, set the Widths of each of the description controls to 3". Delete the labels that have “Sum” as a caption. Set the Top property of the Sum equation control to 0 so it’s on the same line as the description.
Bold the font for all controls in group header and footer sections as well as in the report footer. Close the extra, unused space in each of the group footer sections by dragging the bottom boundary of the section up. Make sure to leave a tiny space below the controls so that the bottom of the box around each sum isn’t chopped off.
KEEPING RECORDS TOGETHER
When looking at the report in Print Preview, you may notice that sometimes a group header starts on the bottom of a page and the associated detail is on the top of the next page. This can be controlled in Design view.
Display the “Group, Sort, and Total” pane at the bottom of the window by clicking the “Group & Sort” button on the Design tab. Select the first group, then click More > and choose “keep header and first record together on one page.” Do the same for each groups listed in the pane. You may need to use the scrollbar to see the last group.
ADJUSTING COLORS
Right now, the same colors in the detail are also used to alternate for every other section. This isn’t a very readable color scheme. By changing the Back Color and Alternate Back Color, we can create a report that’s easier to follow.
Click on the section bar for ProdCat header. From the Format tab of the Property Sheet, choose pale aqua for Back Color and medium aqua for Alternate Back Color. Make the same color choices for the ProdCat footer.
Click on the section bar for the lowest dtSale header (which is the grouping by day). Choose pale orange for Back Color and medium orange for Alternate Back Color. Make the same color choices for the first dtSale footer. Now both the headers and footers for the grouping by day will have the same alternating colors.
For the month header and footer sections, choose pale blue for the Back color and medium blue for Alternate Back Color. For the year header and footer sections, choose pale green for the Back Color and medium green for Alternate Back Color.
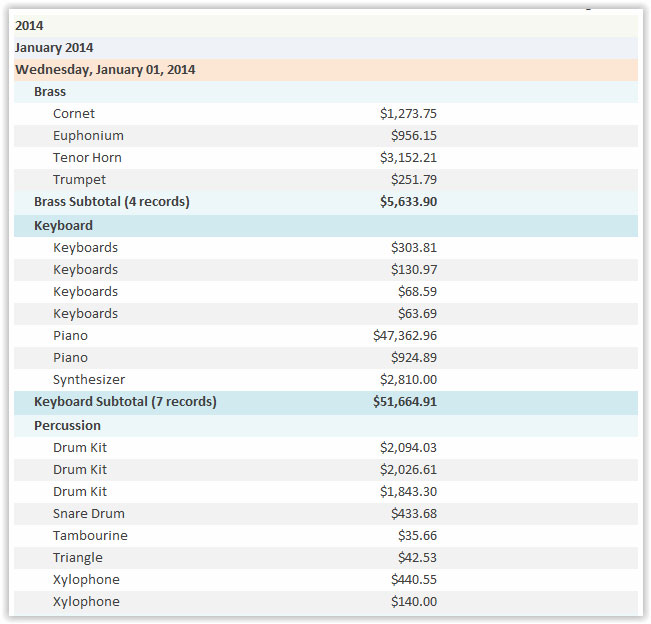
Choose all the description controls in each of these sections and set the Back Style to Transparent so the colors show through. Your final report design should look similar to Figure 1. Figure 2 shows a section of the report in Report view. Go to Report view, and you should see something similar. Save the changes and close the report.


To match the naming conventions for the other objects in our database, rename this report. In the Navigation Pane, right-click on the Product Sales report, choose rename, and call it “r_ProductSales_byYearMonthDayCategory.”
ADD BUTTON TO MENU
Open the fMENU form in Design view. Add a new button to the Report menu page. Name it “btn_OpenProductSales_YrMoDayCategory.” Set its Caption to “Product Sales by Year, Month, Day, Category,” its Width to 3", and match its Left property with those of the other two buttons.
In the Property Sheet, choose On Click. Click the Builder Button (…) and enter this code for the Event Procedure: DoCmd.OpenReport "r_ProductSales_byYearMonthDayCategory", acViewPreview.
From the VBE (Visual Basic Editor)menu, then choose Debug, Compile, and then click the Save icon on the toolbar. Close the VBE, switch to Form view, and test your button!
OPENING THE REPORT USING DATE CRITERIA
The report menu has controls for entering a beginning and ending date so that you can limit the records included on the report will be limited to that timeframe.
The OpenReport action has an optional argument to specify WHERE criteria that’s very easy to use! From the Design view of the fMENU form, click the View Code button in the Tools group. This will open up the code for the form.
Under the Option statements at the top—and not in the middle of any other procedure—we will create a function called GetWhere_SalesDate that will be private to the fMENU and will return a variant so it can be Null (nothing). The reason we make it in its own procedure rather than just adding to the code that processes the report is because we may add more report buttons later that will also need the same criteria.
Here is the code:
Private Function GetWhere_SalesDate() As Variant
'160616 strive4peace
'initialize return value
GetWhere_SalesDate = Null
'construct criteria
With Me.Date1
'if anything is filled out in Date1, then use it for criteria
If Not IsNull(.Value) Then
GetWhere_SalesDate = "dtSale >=#" & .Value & "#"
End If
End With
With Me.Date2
'if anything is filled out in Date2, then add it to criteria
If Not IsNull(.Value) Then
' + concatentate what is in the parentheses
' if ANYTHING in the parentheses is Null
' then that result is Null
' This allows Access to include AND
' only if something else is already specified
' & concatenates Null just fine
GetWhere_SalesDate = (GetWhere_SalesDate + " AND ") _
& "dtSale <=#" & .Value & "#"
End If
End With
End Function
After declaring the procedure scope (Public or Private), the procedure type (Sub or Function), its Name (GetWhere_SalesDate), arguments (nothing in parentheses if there are no parameters), and return value type (variant), press ENTER. Access adds an “End Function” statement. Between those two statements (declaration and End), the first thing to do is initialize the return value of the function to be Null in case nothing is specified.
With Me.Date1 means everything in the block until the End With statement that starts with a dot (.) refers to a property of the Date1 control in the form we are behind (Me). If something is in Date1, then the Value won’t be Null and the criteria will be "dtSale >=#" & .Value & "#". The fieldname is dtSale, and >= signified “greater than or equal to.” Dates are delimited with # so Access knows where the value starts and stops.
Next, we test to see if Date2 contains any value. If it does, criteria is added to the return value of the function. When more criteria is added, AND or another operator must be used and separated (delimited) with spaces. AND means that a record must match conditions for the first part and the next part of the criteria. If nothing was in Date1, then we don’t want to add the word AND after whatever is already there (nothing).
Using + to concatenate inside a phrase in parentheses means that Access will treat everything in the parentheses as null if any part in the parentheses is null. This is a handy way to only include AND if it needs to be there. As before, the dtSale field is used, and # delimits the value. This time <= is used since we want the field value to be less than or equal to whatever is specified. To make sure the code is okay so far, go to the menu and choose Debug, Compile. If Access stops on anything and highlights it, there’s an error and it must be fixed. If nothing seems to happen, that means the code is okay! Good! Click the Save icon on the toolbar (diskette) or choose File, Save from the menu.
Next, we have to get the OpenReport action to evaluate the criteria and use the optional Where parameter in case anything is there. In the code for the button that opens the report, change the statement to:
DoCmd.OpenReport "r_ProductSales_byYearMonthDayCategory" _
, acViewPreview, , GetWhere_SalesDate
The space and underscore at the end the first line means the statement is continued on the next line. After the view parameter (acViewPreview), the Filter parameter is skipped, and a Where clause is specified.
Debug, compile, and save again. Now go to your form and test!
Download this month’s database: sf-nov-2016-report-polish. And see the video below for a tutorial to go along with this month’s column.

November 2016


