REPORT WIZARD
Select the qSalesCrosstab query in the Navigation Pane. From the Create ribbon, choose the Report Wizard command. The first step of the wizard asks where fields will come from. If the qSalesCrosstab query isn’t selected in the Tables/Queries list, use the dropdown to choose it.
Use the double-arrow button to move all of the fields from the Available Fields list to the Selected Fields. Then double-click SumAmount to move it back to Available Fields. Select the last field in the Selected Fields list (Wind), then double-click SumAmount from the Available Fields to add it at the end of the Selected Fields. Click Next.
The second step asks if you want to add any grouping levels. We will leave this blank for now, so click Next to move on to the sort order. In the first dropdown, choose EOMSale. Click Next. Set the layout to Tabular, then click Next. Change the report title to “Sales by Category.” Click Finish.
Access will open the report. The title, Sales by Category, appears at the top of the report, but note that Access also used it as the name of the Report object. This is different than our usual naming conventions for objects, so a good practice will be to rename the object. Close the report. Right-click on the object in the Navigation Pane and select Rename from the shortcut menu. Change the name to “r_SalesCrosstab.”
GROUP & SORT
Open the report in Design view. On the Design tab, click the Group & Sort icon to display the Group, Sort, and Total pane at the bottom of the report. Right now, the only thing there is the Sort by EOMSale. We want to group the report by year and quarter and then sort it by month.
Click Add a group. Choose EOMSale, from oldest to newest, and by year. Click More> to see additional options. Set it to “with a header section” and “with a footer section.”
Click Add a group again. Choose EOMSale again, but this time set it to “by quarter,” “with a header section,” “with a footer section,” and “keep header and first record together on one page.”
To get the grouping and sorting in the proper order, use the dotted “grabber” to the left of the Sort, and drag it below the groups.
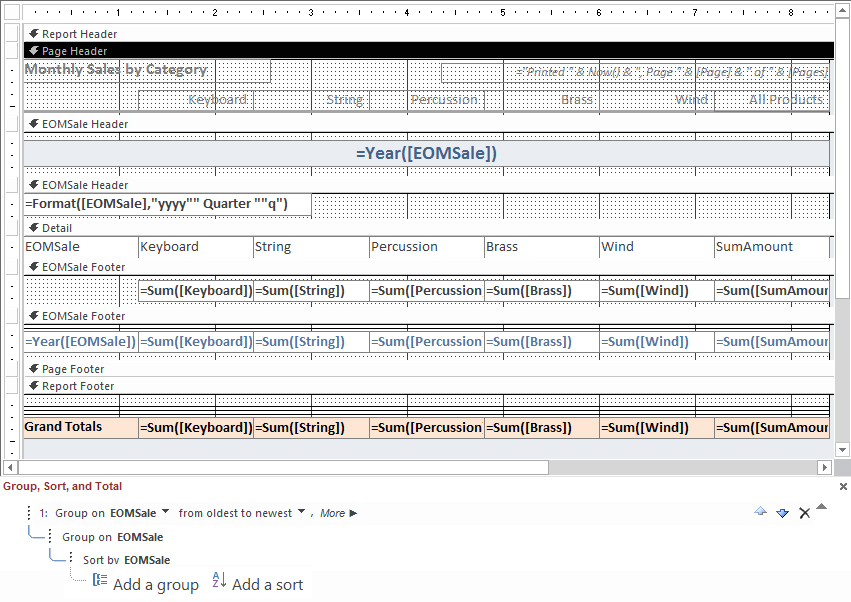
Add a textbox to the first EOMSale header in the report layout. Set its Control Source to =Year([EOMSale]), then delete its label control. In the second EOMSale header, add a textbox with Control Source =Format([EOMSale],“yyyy” “ Quarter ”“q”). Delete the label control.
ADD CONTROLS
Add lines to the to the tops of each report section with subtotals. Use two lines at the top of the Year footer and three lines at the top of the Report footer section with the grand totals. To size the lines exactly, set their Width and Height properties in the Property Sheet. To position the lines, set their Top and Left properties.
For consistency, make sure the textboxes in the Detail section and the labels in the Page header are the same width. To select multiple controls, hold down CTRL and then click on each control you want to select. Then go to the Property Sheet and set the Width to 1.2 inches.
To add totals for each product type, select the textbox controls in the Detail section, from Keyboard to SumAmount. Right-click on the selection and press CTRL+C. Click on the section bar header for the first EOMSale footer and press CTRL+V to paste the controls. Then modify the control source for each of the new textbox controls to =Sum(fieldname), for instance, =Sum(Keyboard) and =Sum(Brass).
Once the sum controls are changed, copy and paste them into the second EOMSale footer and into the Report footer. Line up the controls by selecting multiple controls, right-clicking, and choosing Align > Left or Align > Right on the shortcut menu.
Just like objects in the layout, the sections also have properties that can be edited using the Property Sheet. If you don’t want color in the group sections, set Back Color to White and Alternate Back Color to No Color for group header and footer sections.
Make room in the Page header section for the report title, date, and page number. Select all the labels in the Report header and set the Top property to 0.3 inches.
Change the font size of the report title in the Report header to 12 points. Double-click a resizing handle on the label control so that it resizes to the best fit. Move the title to the top left of the Page header.
Move the page number from the Page footer to the right side of the Page header. Then change the Control Source to =“Printed ” & Now() & “, Page ” & [Page] & “ of ” & [Pages] and make the font size smaller. Delete the other control in the Page footer.


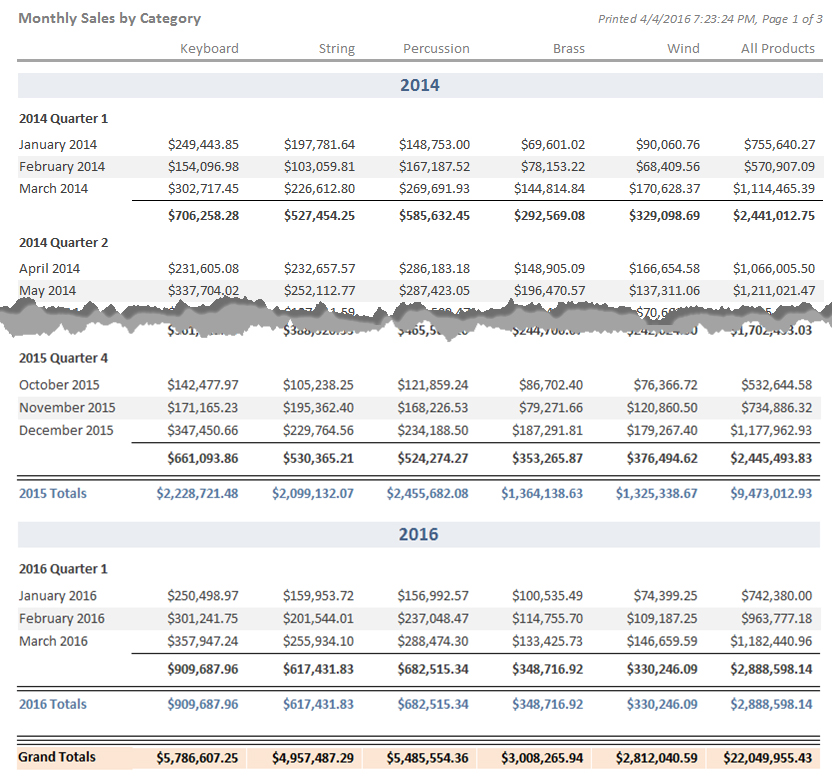
Figure 1 shows what the finished report might look like in Design view. Figure 2 shows the top and bottom of the grouped report with data. Notice how the same equation gets different results depending on where it’s placed in the design. To try this out for yourself, download the databases for this month: May_GroupedReport. Next month, we’ll add more calculations to this report, including equations to report percentages of totals.
SF SAYS
The same equation can be used to get different subtotals in each Control Source in the group and report headers and footers.

May 2016


