CROSSTAB QUERY
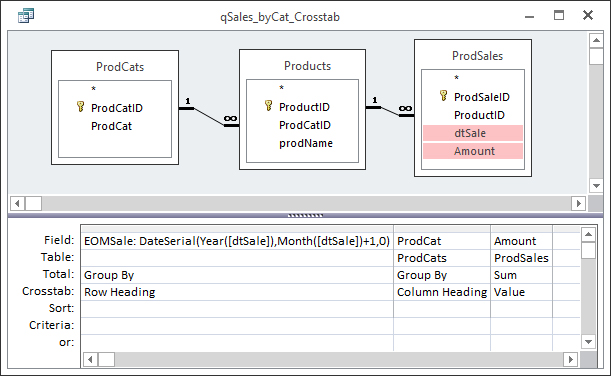
You can use the query wizard to create a crosstab query, but we will build the query from scratch so we can combine the tables and pivot in the same step. Make a new query. Choose all three tables. Relationships are defined beween the tables, as shown in Figure 1. The ProdCats (product categories) table contains records for Brass, Keyboard, Percussion, String, and Wind. In the Products table, each record has the product name and a category. The sales of those products are stored in the ProdSales table. The date of the sale is dtSale, and the revenue is called Amount. All three tables include fields with “ID” as part of the name. These are the primary or foreign keys.

Change the query type by right-clicking in the gray area of the query design and choosing Query Type, Crosstab Query from the shortcut menu. You can also change the type by going to the Design ribbon tab and selecting Crosstab in the Query Type group.
Enter EOMSale: DateSerial(Year([dtSale]),Month([dtSale])+1,0) into the first field. The DateSerial function needs three numbers, which represent year, month, and day. For the year, Year([dtSale]) returns the year from the date of sale. Month([dtSale]) does the same for the month, to which we’re adding one (1). We’re using a zero (0) for the day because “zero day” of the next month is, mathematically, equal to the last day of the current month. The Total line for this field should be set to Group By, and the Crosstab value is “Row Heading.”
The field in the second column is ProdCat, with the Total line set to Group By, and the Crosstab value is “Column Heading.” The third field is Amount. The Total is Sum, and the Crosstab is “Value.”
Save the query and call it “qSales_byCat_Crosstab.” When you switch to Datasheet view, you will see that the product category names (ProdCat) have become column names. This provides a lot of flexibility.
COLUMN HEADINGS
Crosstab queries are extremely useful, but there are restrictions when using them for record sources. Because column names are dynamic, Access doesn’t know what to do with a crosstab query used as a source unless the column names are specified.
With the query in Design view, click on a gray area of the query design. Display the Property Sheet. Clicking on the gray area should ensure that the selection type is Query Properties. Enter “Keyboard”, “String”, “Percussion”, “Brass”, “Wind” as the column headings. Switch to Datasheet view, and you will see that the columns appear in the same order. This query will be the row source for a chart. Save and close.
CROSSTAB SQL
The resulting SQL statement for the crosstab query is:
TRANSFORM Sum(ProdSales.Amount) AS SumOfAmount SELECT DateSerial(Year([dtSale]),Month([dtSale])+1,0) AS EOMSale FROM (ProdCats
INNER JOIN Products
ON ProdCats.ProdCatID = Products.ProdCatID)
INNER JOIN ProdSales
ON Products.ProductID = ProdSales.ProductID
GROUP BY DateSerial(Year([dtSale]),Month([dtSale])+1,0) PIVOT ProdCats.ProdCat In ("Keyboard","String", "Percussion","Brass","Wind");
STACKED COLUMN CHART
Create a new form using Form Design. In Design view, create a chart object. (Choose Chart from the controls group of the Form Design Tools Design ribbon tab. Click through the questions of the wizard—the answers don’t matter as all of that will be changed.) Once the chart is placed, set its Row Source on the Property Sheet to qSales_byCat_Crosstab.
Double-click on the chart object to begin working on it. Right-click within the chart area (but not on a specific object), and choose Chart Type. In the dialog box, select Column, Stacked Column (the second subtype in the top row). Click OK to close the dialog box. Right-click on the chart legend and select Format Legend. On the Placement tab, select Bottom. Click OK.
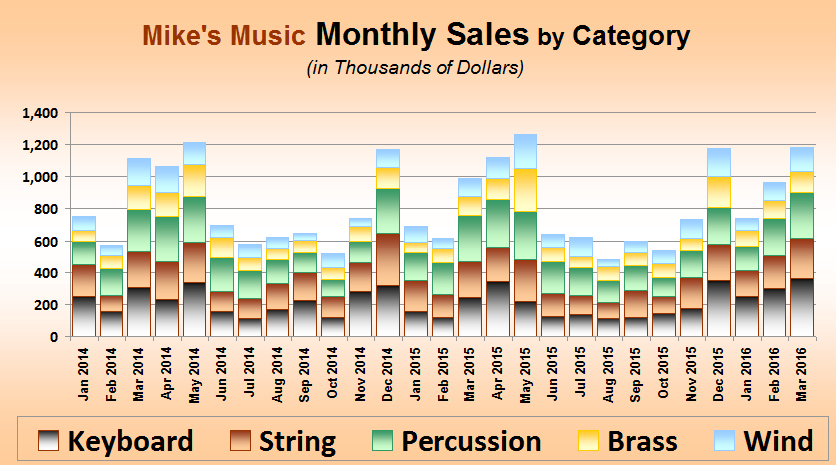
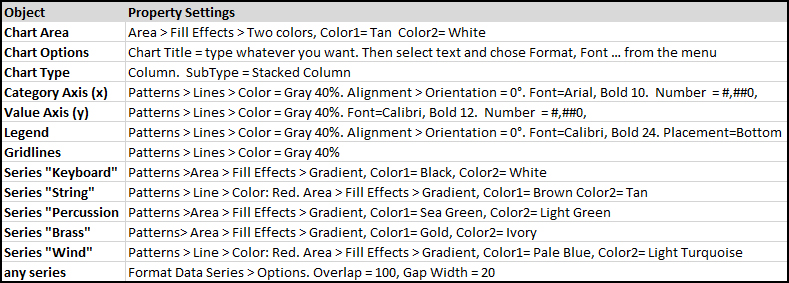
Click outside the hatched chart area to temporarily quit editing the chart. Change to Form view, save the form using an appropriate name. Return to Design view. With the chart now rendered properly, you can use the resizing handles to make it bigger. If needed, you can also resize the form canvas by placing the mouse on the bottom or right boundary. When the mouse cursor changes to a double-headed arrow with a line through it, click and drag the boundaries to resize. To change the design of the chart itself, e.g. colors, formatting, and other options, double-click the chart object to return to chart editing. Figure 2 shows the final result of a stacked chart. And figure 3 shows the property settings.


To try this out for yourself, download the databases for this month: Stacked Column Chart--2016-04. Next month, we will create a grouped report with subtotals and grand totals.
SF SAYS
To use a Crosstab query as a row source for a chart, you need to specify the column headings in the Property Sheet.

April 2016


