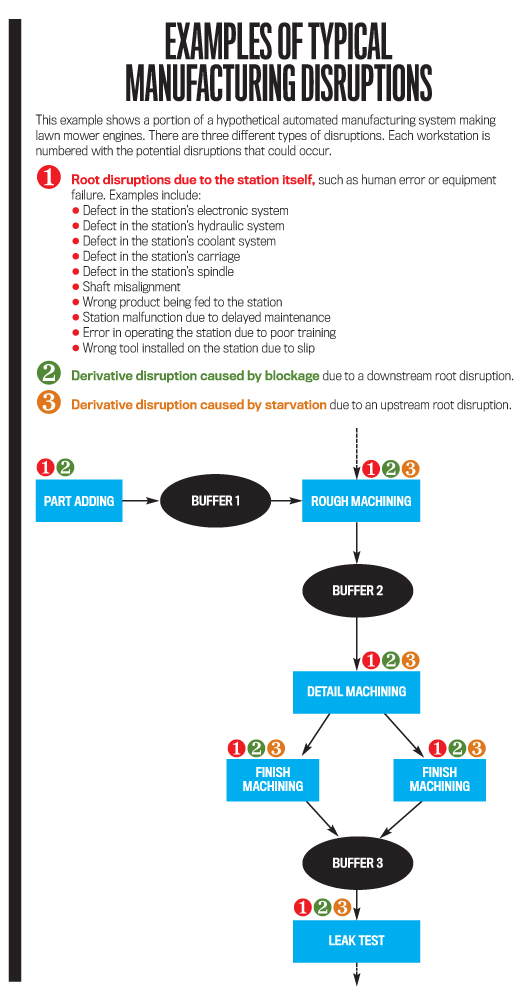
Measuring the cost of disruptions is challenging for two reasons. First, the impact of each disruption isn’t predictable but depends on the characteristics of the automated manufacturing system at the moment the disruption occurs. One disruption might stop an adjacent manufacturing station and even shut down the whole system, while another disruption might have no effect on system output. Second, multiple disruptions might occur simultaneously, making it difficult to separate the impact of one disruption from another.

Current plant-floor costing strategies, such as activity-based costing (ABC), consider each workstation independently. They don’t take into account the interdependence among workstations and thus can’t accurately measure the cost of individual disruptions. So we devised a simple procedure to measure the cost of manufacturing disruptions using a system-based approach. But before we discuss our procedure, let’s look at how we analyzed the problem.
ANALYZING DISRUPTION COST
From pharmaceutical plants to automotive assembly lines, automated manufacturing systems play a critical role in modern manufacturing facilities. Their multistage design dramatically improves productivity but makes them vulnerable to random disruptions caused by equipment failure and/or human error.
Disruptions are a cost driver that reduces production volume and generates opportunity cost because the time lost due to disruptions could have been spent making products and generating profit. For example, if one workstation is down for a day, the opportunity cost for this disruption is the profit a functioning assembly line can make in a day.
Disruptions are the basic cause of manufacturing inefficiency. Understanding the cost of individual disruptions provides flexibility, allowing us to look at:
- The cost for a workstation or a group of workstations (a spatial view),
- The cost per shift or year (a temporal view), or
- The cost of equipment failure or human error (a causal view).
This multidimensional approach enables us to determine, for example, the disruption cost for a workstation over a five-day period after an equipment failure or the disruption cost for a group of workstations during an employee’s shift attributed to that employee’s operation errors.
Such flexible and powerful information facilitates managerial decision making. Instead of relying on intuition or qualitative trial and error, CFOs can use disruption costs to make informed decisions about risk management and capital investment. In addition, accurate disruption costs can guide continuous improvement activities and can enhance strategic cost management practices at the plant-floor level. Specifically, CFOs and their team can achieve at least three objectives: (1) evaluate the performance of an individual workstation or worker, (2) measure the economic consequences of various disruption causes, and (3) compare the cost of disruptions with the cost of preventive and continuous improvement activities. Management can then prioritize potential efficiency-improving investments.
In fact, once the cost of disruptions is known, it’s possible to derive many performance measures commonly used at the plant-floor level, such as manufacturing cycle efficiency, schedule adherence, and rework rate. That’s because disruptions cause inefficiency in the manufacturing cycle, create unfavorable variance in production time, reduce capacity utilization, impact on-time production, and lead to defects and increased rework rate.
MEASURING THE COST OF DISRUPTION
Borrowing insight from throughput analysis research, we recognized that the system production loss measured at the end-of-line workstation should serve as the starting point for measuring the cost of individual disruptions. A disruption doesn’t incur cost unless it stops or slows the end-of-line workstation. Therefore, measuring the cost of disruptions is equivalent to quantifying the economic impact that individual disruptions have on the output of the end-of-line workstation. Based on this notion, we devised a four-step procedure to measure disruption cost:
- Identify time intervals.
- Allocate production loss.
- Aggregate production loss.
- Convert loss to cost.
The technology in most modern manufacturing facilities is able to generate real-time data on the location, duration, and cause of individual disruptions, making this procedure possible. Let’s take a look at each step.
Step 1: Identify Time Intervals
Divide the production of the end-of-line workstation into time intervals that contain only one disruption or concurrent disruptions (i.e., two or more disruptions that occur at the same time). Then identify the system production loss incurred within each interval.
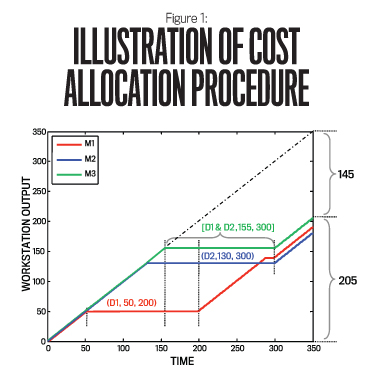
Figure 1 presents a simple example. The manufacturing system consists of three workstations. Parts are being processed by workstations M1, M2, and M3 in sequential order. M3 is the end-of-line workstation. Without interruption, the system output during the time period [0, 350] should be 350 units. But the actual output is only 205 units because M3 was stopped during the time period [155, 300], which generated 145 units of production loss. The reason for the stoppage of M3 is that M1 was shut down by disruption D1 during time period [50, 200] and M2 was shut down by disruption D2 during time period [130, 300], cutting off the inflow of parts to M3.

The objective is to measure the cost of disruptions D1 and D2. Divide the stoppage of M3 during time period [155, 300] into two intervals: time period [155, 200] (during which D1 and D2 were both occurring) and time period [200, 300] (which was after D1 was remedied but D2 was still taking place). The production loss is 45 units in the first interval and 100 units in the second.
Step 2: Allocate Production Loss
When disruptions occur in isolation, skip Step 2 and move directly to Step 3. If multiple disruptions occur simultaneously, then it’s necessary to allocate system production loss among them. There are two ways to do this. The loss can be allocated based on the weighting factor of each disruption, calculated as the projected production loss divided by the actual production loss. Alternatively, a simpler but less robust approach is to allocate on an average basis. In Figure 1, for example, the 45 units of production loss during the time interval [155, 200] were incurred because of concurrent disruptions D1 and D2. Therefore, each disruption is allocated with half of the production loss, or 22.5 units.
Step 3: Aggregate Production Loss
If a time interval contains only one disruption, then the system production loss of that interval is allocated completely to the disruption. In Figure 1, the 100 units of production loss in interval [200, 300] are allocated solely to D2 because that was the only disruption.
Once the production loss in each interval has been allocated to corresponding disruptions, add up the total production losses for each disruption across all time intervals. This provides the total production loss caused by each disruption. For example, the total production loss of D1 is 22.5 units because interval [155, 200] was the only interval that allocated lost units to D1. In comparison, D2 caused 22.5 units of production loss in interval [155, 200] and 100 units in interval [200, 300], for a total of 122.5 units.
Step 4: Convert Loss to Cost
The final step is to convert the production loss into a cost amount, thus measuring each disruption’s economic consequence. Multiply the total production loss of a disruption by the unit contribution margin (revenues per unit minus variable expenses per unit) to obtain the cost for that disruption. The unit contribution margin approximates the lost opportunity cost for one unit of production loss. In the example in Figure 1, assume the unit contribution margin is $1. Thus, the costs of D1 and D2 are simply $22.50 and $122.50, respectively.
If contribution margin information is unavailable or fluctuates heavily, an alternative is to use the budgeted fixed manufacturing cost divided by a denominator capacity (that is, the fixed manufacturing overhead rate) to approximate the fixed manufacturing cost per unit of underproduction. Assuming a fixed manufacturing overhead rate of $0.50, then the costs of D1 and D2 are $11.25 (22.5 5 $0.50) and $61.25 (122.5 5 $0.50), respectively. In standard costing practices, fixed manufacturing cost is treated as a variable cost, and the cost of underproduction is recognized through a production-volume variance. Therefore, the cost of a disruption obtained in this approach is simply the unfavorable production-volume variance caused by the disruption.
KEY BENEFITS
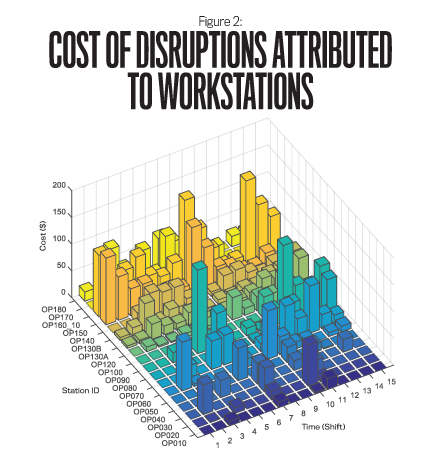
Once implemented, the costing procedure provides multidimensional information of significant value. Consider, for example, a simulated study using parameters adapted from an automobile assembly plant. The assembly line consists of 18 workstations and eight buffers. Figure 2 shows the cost of disruptions accumulated at the workstation level per shift over a five-day period. The costs are highly varied across workstation and time. Several workstations incurred significant disruption cost, including workstation OP160_10 during shifts 1, 9, and 15; workstation OP150 during shifts 1, 8, and 15; and workstation OP090 during shifts 5 and 12. These are cost bottlenecks. Knowing this information can lead to better evaluations of workstation performance and makes it easier to improve overall performance by focusing efforts and resources on reducing the cost bottlenecks.

Cost can also be aggregated based on the cause for each disruption (such as equipment failure or human error), which offers a useful tool for disruption-management strategies. More important, cost accumulated during a long period of time, such as a fiscal year, provides guidance for prioritizing workstation upgrades and for employee training and replacement.
The procedure also makes it possible to generate an efficiency rating for each potential improvement activity to evaluate future cost savings in relation to the expected investment. If it takes $150,000 to reduce a cost bottleneck’s disruption cost by $187,500, then the efficiency rating for this improvement activity is 1.25 (that is, $187,500/$150,000). And if it takes only $1,500 to reduce the disruption cost by $75,000 for a different workstation, that efficiency rating is 50 ($75,000/$1,500). Although the improvement on the first workstation would significantly enhance system efficiency, an investment that targets the latter workstation appears more sensible if budgetary constraints are a concern.
OTHER APPLICATIONS
Our proposed costing procedure can go beyond identifying cost bottlenecks, evaluating performance, and continuous improvement. It’s also useful for controlling human error and managing the supply chain.
Human Error
Human error is a primary cause of disruptions, including slips, rule-based mistakes, and knowledge-based mistakes. Using our proposed costing procedure, it’s possible to summarize the cost attributable to each type of human error, which approximates the potential cost savings to be generated from improvement activities targeted at controlling each type. As much as the efficiency rating helps in comparing investments in different workstations, the benefit of improvement activities focused on human error can be measured against the cost of implementing them.
Moreover, disruption cost information may serve as a benchmark for target setting, training, and compensation purposes. Overall, the disruption cost information acts as a decision-facilitating tool to measure the economic consequence of human error and as a decision-influencing tool to motivate improvement, reflecting the spirit of strategic cost management.
Supply Chain Management
Because this approach relies on real-time data instead of statistics, it can also be used to measure disruption cost in supply chains. This is because the configurations of most manufacturing systems are similar to the configurations of typical supply chains. Nevertheless, the results from our study can’t be readily generalized to supply chain management for two reasons. First, the processing speed of a supply chain, often influenced by seasonal demand and transportation schedule, isn’t constant like most automated manufacturing systems. Second, suppliers are usually unwilling to share detailed information with their customers, which makes it difficult to obtain real-time information about disruptions. Despite these obstacles, our proposed procedure—which considers interdependence among workstations and only recognizes the disruptions leading to the stoppage of system output that affect overall efficiency—have implications for various issues in supply chain management, such as performance monitoring, risk assessment, supplier evaluation, and continuous improvement.
In conclusion, CFOs and other management and supervising personnel can use our proposed procedure to rank workstations, identify cost bottlenecks, and generate investment efficiency ratings for improvement activities. It’s also important to understand that once a workstation is no longer a cost bottleneck, further investment in it might not lead to significant efficiency gains for the system. Therefore, it may be necessary to adjust the focus on the fly when a new cost bottleneck arises.
Note: The authors’ study was funded by a research grant from the IMA® (Institute of Management Accountants) Research Foundation. For technical details and more discussion, please refer to their forthcoming article that will be published in the Journal of Management Accounting Research.

December 2015


