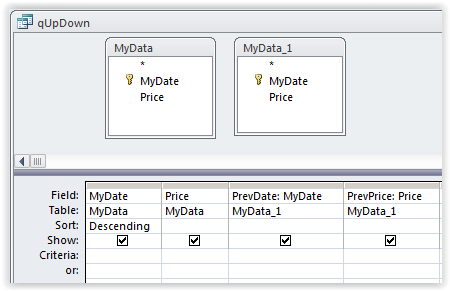
A simple example to demonstrate this technique is to compare stock prices. We’ll use data from historical stock prices for Microsoft stock (Nasdaq: MSFT). We’ll start with a table called MyData, which contains a date field (MyDate) and currency field (Price) for the close price of the stock. Create a new query using MyData as the source, and add the MyDate and Price fields to the grid. Sort by MyDate in descending order.
Now we need a different record from the same table. To do this, add another copy of MyData to the query design. Because each source must have a unique name, this copy of MyData gets _1 appended to the end of its name, becoming MyData_1. (If we added another copy of the table, it would be called MyData_2. Although we don’t do it here, tables can be given an alias or other name to use if you’re worried about any confusion.)
In the query design, MyData will represent the current record, and MyData_1 will represent the record for the previous value, such as yesterday or whenever it was recorded.
From MyData_1, add MyDate and Price to the grid. Field names must be unique, so name them PrevDate and PrevPrice. The resulting expressions in the field cells are PrevDate:MyDate and PrevPrice:Price, as shown in Figure 1.

Now calculate the difference between the prices by subtracting the previous price from the current price. Enter Diff:CCur([MyData].[Price] -[MyData_1].[Price]) into a field cell. This will give us the information needed to show whether a price has gone up, gone down, or stayed the same.
THE GRAPHICAL INDICATOR
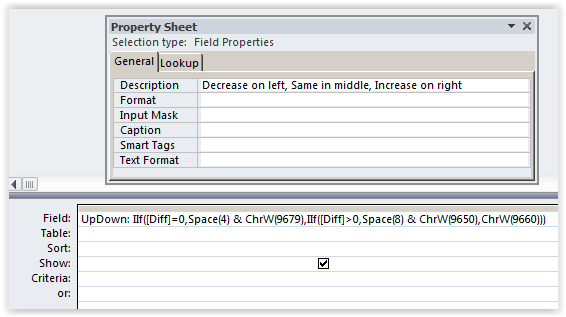
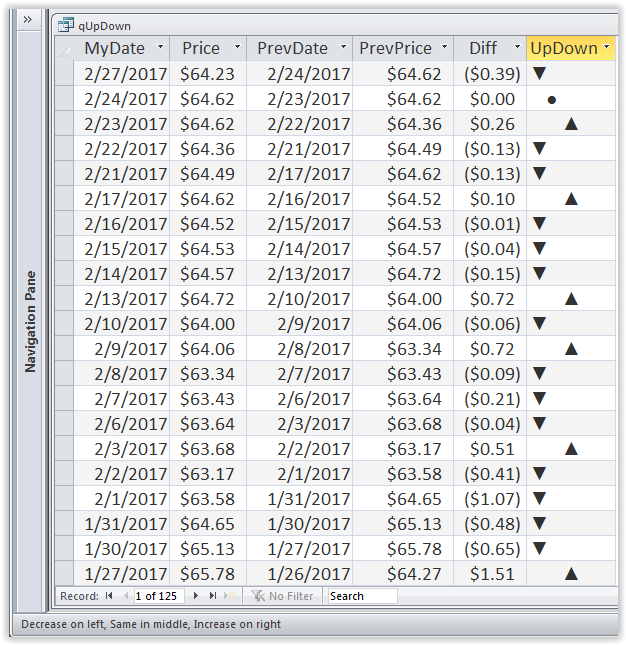
The symbols to use for the data visualization are Unicode decimal 9679 for a filled circle, 9660 for a down-pointing triangle, and 9650 for an up-pointing triangle. To enhance the visualization, the indicators can be staggered within the column: Decreases will be shown with a down-pointing triangle on the left. If there’s no change, it will be a filled circle in the middle. And increases will be shown with an up-pointing triangle on the right. This can be done by adding space before the middle and right markers. Enter UpDown:IIf([Diff]=0, Space(4)&ChrW(9679), IIf([Diff]>0, Space(8)&ChrW(9650), ChrW(9660))) into a field cell.
The ChrW function displays the Unicode symbol corresponding to the given decimal code. The Space function creates a given number of spaces. The IIf function evaluates a condition (first parameter), and then returns the value calculated by the second parameter if true or the third parameter if false. In this example, the IIf function is nested to provide three outcomes instead of two.
To provide a key so users know how to interpret the visualization, add a message to be displayed on the Status Bar in the lower left when the user clicks in the UpDown column. To do so, open the Property Sheet for that column and add the message in the column Description (see Figure 2).

LINKING WITHOUT A JOIN LINE
We’re comparing one date with a previous date, but the MyData table doesn’t have a separate field for the previous date. That means we can’t use a join line to link the tables (MyData and MyData_1) in the query. Instead, we’ll use criteria to correctly retrieve records from MyData_1 for the previous date before the date in MyData.For the PrevDate field in the query, add this to the Criteria row:DMax("MyDate","MyData","MyDate<#"&MyData.MyDate &"#").
DMax returns the maximum value of an expression, which can be a field name or formula that performs a calculation. The syntax is DMax(Expr, Domain, Criteria), where Expr is the expression, Domain is a table or query name, and Criteria (which is optional) limits the records to consider.
In our example, the expression is the MyDate field and the domain is MyData. In the Criteria argument, the less-than operator (<) restricts the DMax function to search only for earlier dates, and the # delimiters around the value signal it’s a date rather than a string or number.
Dates are a problematic data type because they’re entered and displayed differently depending on where you are inhe world. If your Windows Region settings specify an alternate date format, the date value can be converted to the ISO format or American format for Access to properly understand. For criteria in ISO format, use "MyDate <" & Format([MyData].[MyDate], "#yyyy-mm-dd#"). The format code can also be "#mm/dd/yyyy#" for the American format, including the # delimiters that Access needs. Any character preceded by back-slash () displays as written; mm is the two-digit month number; dd is the two-digit day number; and yyyy is the year.
Save this query as “qUpDown.” See Figure3 for the results.

USING SQL
To speed performance, a subquery can be used instead of DMax. Here is the resulting SQL Statement:
SELECT MyData.TheDate
, MyData.Price
, MyData_1.TheDate AS PrevDate
, MyData_1.Price AS PrevPrice
, CCur(MyData.Price - MyData_1.Price) AS Diff
, IIf( diff=0
, Space(4) & ChrW(9899)
, IIf(diff>0
,Space(8) & ChrW(11205)
,ChrW(11206)
)
) AS UpDown
FROM MyData
, MyData AS MyData_1
WHERE ( MyData_1.TheDate
= (
SELECT Max(a.TheDate)
FROM MyData as a
WHERE a.TheDate < MyData.TheDate
)
)
ORDER BY MyData.TheDate DESC;
Download this month’s database: sf-1708-TrianglesCircles.
SF SAYS
Add triangles and circles to a query to indicate if values increased, decreased, or stayed the same.

August 2017


