Originally, the survey was focused solely on members in the United States. Eventually, other surveys were added that covered members in other countries and globally. Last year, those surveys were combined for the first time into a single, global survey for all members. This year continues that effort, presenting the results from IMA’s global salary survey.
The report presents high-level results from this year’s survey and compares compensation levels and job satisfaction across the globe. Because this is the second year of conducting a single survey, global trends should be easier to track, and regional comparisons are enhanced. Additionally, we look at other factors that contribute to job satisfaction, such as hours worked, opportunity for advancement, and work-life balance. As this is only the second year conducting a single global survey annually, comparing this year’s results to prior year’s global reports must be done with caution.
HOW WE CONDUCTED THE SURVEY
In October-November 2015, survey invitations were sent to 23,373 IMA members around the world. We received 2,766 responses—an 11.8% response rate. Of these, 2,740 responses were usable (included both country and salary information). For the purposes of the salary results, only respondents who indicated that they were either full-time employees or self-employed are included, which reduced the number of responses to 2,593. We eliminated eight responses for low salaries reported (less than $100 total compensation per year), leaving 2,585 usable responses.
GLOBAL RESPONSE
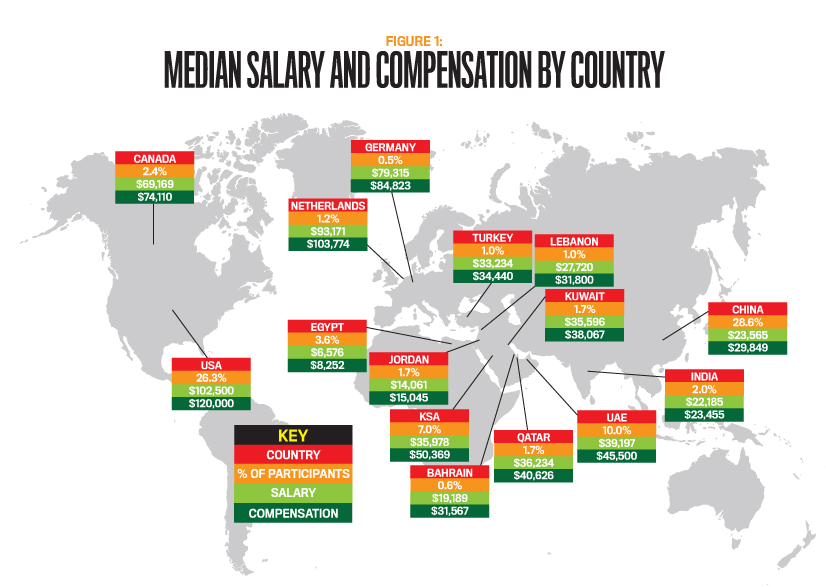
Responses to the survey were indeed global, with a total of 2,585 usable responses coming from 81 countries across the globe. Figure 1 lists those countries that included at least 1% of survey respondents (as well as Bahrain and Germany, which historically have had a significant number of respondents), along with their median salary and total compensation. (All monetary values are in U.S. dollar equivalents as of the time of the survey.) For the first time ever, the number of Chinese respondents outnumbered the number of U.S. participants, reflecting the increased emphasis on management accounting and the CMA® (Certified Management Accountant) designation in China.
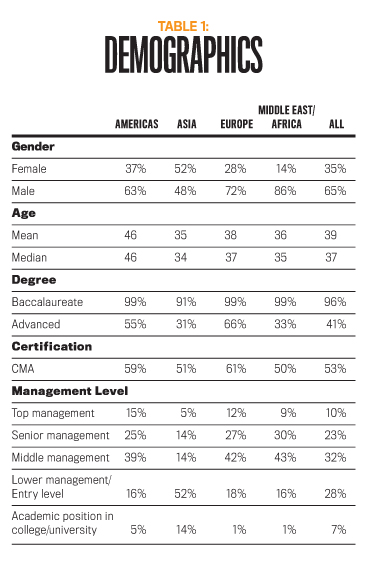
Table 1 presents specific characteristics of respondents from the various regions: the Americas, Asia, Europe, and Middle East/Africa. Male respondents were more common in all regions except Asia, where women accounted for 52% of the respondents. That response rate continues an upward trend—two years ago, women made up only 22% of respondents in Asia.
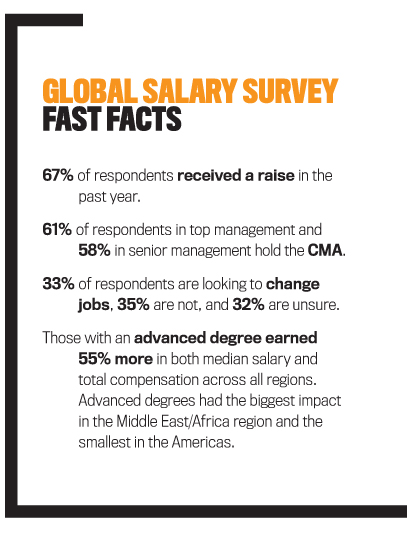
Almost all respondents have at least a baccalaureate degree (96% overall), and respondents in Europe are most likely to possess advanced degrees and the CMA, followed by those from the Americas. The percentage of respondents holding the CMA designation is up for all regions. Asia had the highest increase of CMAs, going from 40% last year to 51% this year.
Respondents in Asia tend to be younger than those in other regions, and fewer hold higher-level management positions. Those in Asian and Middle East/African nations show the lowest rate of advanced degrees at 31% and 33%, respectively.
Respondents in the Americas continue to be older on average. This year, it’s by more than 10 years. The Americas also continue to have the largest percentage of respondents in the high-ranking managerial positions, but the Europe and Middle East/Africa regions are close. This finding suggests that IMA members are increasingly becoming top leaders in their companies.
COMPENSATION
Table 2 lists the annual salary and total compensation (which combines salary with any additional compensation, such as bonuses, profit sharing, etc.) for each major region. The global mean salary is $65,868, and the median salary is $49,410. Mean total compensation is $80,812, and median total compensation is $56,556.
Though these numbers are lower than last year’s results—for example, last year’s median salary was $60,000—that’s due in most part to the overall mix of respondents becoming less U.S.-centric and more global. For example, this year’s higher proportion of responses from China and other Asian countries, where the respondents are younger and salaries are lower than in the Americas, no doubt affects the final results.
While those results show the impact on the overall numbers, they also highlight the significant variation by region. Comparing the regional results to last year’s numbers provides clearer insight into the year-to-year differences.
Respondents from Europe and the Americas continue to report the highest compensation, with the Americas reporting higher median values over last year. European median compensation values decreased more than 6% from last year. German median base salary and the Netherlands median total compensation values were the only ones to show an increase from last year.
As in prior years, the changes by specific country vary significantly. For example, Swiss and Dutch compensation levels are much higher than those of other European countries. At the same time, Russian and Turkish compensation levels were significantly less than those of other European countries and much lower than last year, probably reflecting lower oil prices and the current economic and political instability in those countries.
Compensation in the Middle East/Africa varies tremendously, with declines ranging 13%-18% from last year. This is likely a reflection of the economic impact of ongoing conflict in the region and the sharp decline in the price of oil. The only country to show an increase is Lebanon, which saw median total compensation increase 20% to $31,800. That amount, however, is still well below its value from two years ago ($50,711). The results for respondents in Egypt are again the lowest in the region. The median salary is similar to last year ($6,576 this year compared to $6,829 last year), while the total median compensation at $8,252 declined further from last year’s $9,379. At $50,369, Saudi Arabia (KSA) has the highest median total compensation in this region, unseating Qatar, which has a significantly lower median total compensation this year ($40,626) compared to last year ($64,000).
Asia continues to report the lowest total regional compensation. While likely a reflection of the lower cost of living in Asia, it can also be partially accounted for by the younger average age of those in the region as well as the lower percentage of respondents who possess advanced degrees, CMA certification, or higher-level positions. But this trend may be changing. As noted earlier, the percentage of Asian respondents with CMA certification increased significantly over last year.
For the Americas, compensation results increased approximately 2%-3% over last year’s survey. Last year, the median salary was $96,400 and median total compensation was $110,000. This year, they are $98,217 and $113,000, respectively.
GENDER GAP
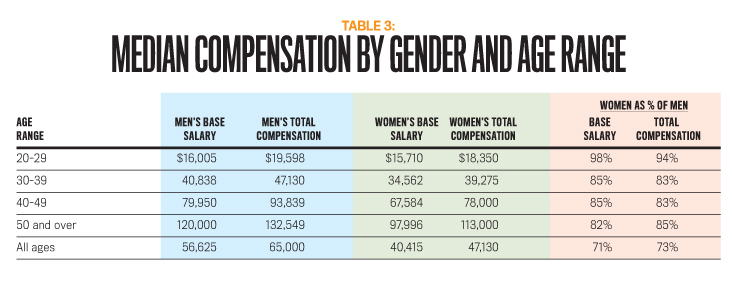
Table 3 shows the median compensation values by gender and age. Every year, the salary survey tracks the difference in compensation between the genders (expressed as a percentage of women’s compensation in proportion to men’s compensation). This year, the salary gap is 71% in median base salary and 73% in median total compensation.
Compared to last year, the gap narrowed slightly for those in the later years of their career. For respondents in the 50 and over age range, women’s median base salaries and total compensation are 82% and 85%, respectively, of the amounts paid to their male counterparts (up from 80% and 81% last year). More good news is that the gap for women in the 20-29 age range is rather small at 98% and 94%, which are similar to last year’s results.
Additional insight can be gained by looking at gender compensation by region and age. For respondents in the Americas age 20-29, the median total compensation is almost equal ($60,000 for men compared to $58,500 for women). In the Middle East/Africa region, the median salary and total compensation levels were higher for women in the 20-29 age bracket than for men in that group, leading to a “gap” of 155% in median salary and 144% in median total compensation. In contrast, the gap is quite high in Europe for this age range, with women earning only 63% and 65% as much as their male counterparts.
But the gap still widens with increasing age. This is most apparent in the Middle East/Africa region. While women in the youngest age bracket earn more than men, the gap for those in the 40-49 age group is 60% and 53%, respectively. Asia is similar, though not as pronounced. The median salary and total compensation gaps for those age 20-29 are 90% and 91%, respectively, and 50% and 52%, respectively, for those age 40-49.
In Europe, the good news is that the median salaries and compensation for women in the 30-39 age group are slightly higher than for men. But the salaries and compensation for women in the 20-29 and 40-49 age groups are only 53%-65% of those for men.
It’s alarming that women’s median compensation in the Asia, Europe, and Middle East/Africa regions for the 40-49 age group is only about 50%-65% of that for men. The promising news is that the gender pay gap is mostly small or nonexistent for those now entering the management accounting field. This is a pattern that has been noted in the last few years, but it’s still too soon to know if the small difference will remain as those respondents get older.
CMA CERTIFICATION
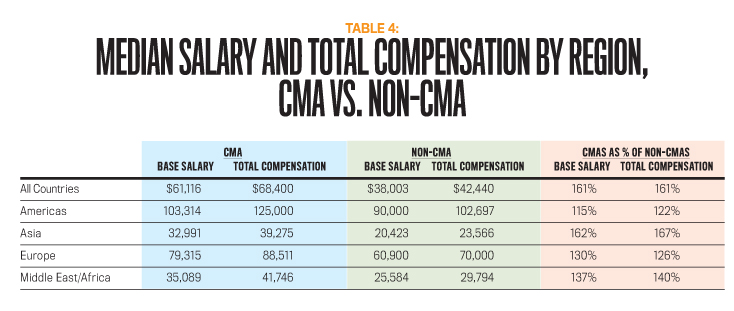
Those holding the CMA continue to report significantly higher salaries and compensation than non-CMAs (see Table 4). CMAs globally earn 61% more than non-CMAs for both median salary and total compensation. This provides strong evidence that employers in every region value the skills possessed by CMAs and are willing to pay more for staff with these skills. A public accounting director in Namibia wrote, “…to get a CMA designation on my letterhead will definitely boost fees income.”
CMAs in all age groups have higher salaries and compensation than their non-CMA counterparts. As one 29-year-old Jordanian chief accountant commented, “I got the 33% salary increase in the last year because I got the CMA.” And while younger CMAs often reap an immediate financial benefit from the CMA designation, the value is greater for those in the 30-39 age bracket, where CMAs earn a 40%-50% median premium for the designation. One respondent wrote, “The CMA did not seem to help me when I first got it at age 25, but after a lot more work experience, it helped me to obtain my current promotion. I now work directly in management accounting providing reports to the board of directors.”
Besides differences in pay, 86% of CMAs across all regions feel that the certification enhances their ability to move across areas of the business, while 79% said it creates career opportunities.
RESPONSIBILITY AREA
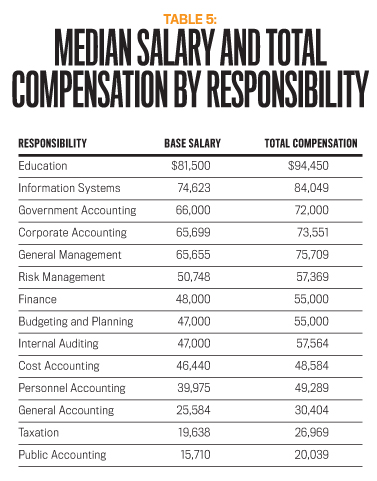
Salaries and total compensation vary considerably by responsibility area. This year, the top-paying responsibility areas internationally, based on median total compensation, are education in first and information systems in second (see Table 5). Last year, it was information systems followed by education. The next three highest-ranked responsibility areas this year are government accounting, corporate accounting, and general management.
The top-five responsibility areas are strongly influenced by U.S. respondents. When you remove U.S. respondents, education is ranked 10th and information systems is seventh. An especially large increase in the area of government accounting moves it to the top-ranked non-U.S. responsibility area. The major reason for this increase is a very different and smaller mix of government respondents than last year, with relatively more respondents in countries that tend to have higher compensation. Another area that increased significantly is internal auditing, reflecting increased corporate awareness of this area as part of risk management controls and the resulting enhanced compensation for individuals with these skills.
With ongoing economic and geopolitical challenges in many regions, salaries for non-U.S. respondents have declined in most other traditional areas of responsibility (e.g., information systems, corporate accounting, taxation, general accounting, and budgeting and planning). On the other hand, salaries for accountants in government and internal auditing are relatively higher.
The overall results—including U.S. respondents—are influenced by the much higher compensation for U.S. faculty compared to those in other countries. In fact, the U.S. median total compensation for those in education is $139,000 compared to only $29,405 elsewhere. Corporate accounting, finance, and budgeting and planning are also especially high in the U.S., which shows that even though business is becoming increasingly global, cultural and regional influences—as well as cost-of-living differences—still affect the amounts employers are willing to pay for different types of accounting jobs.
JOB SATISFACTION
Aside from compensation, another factor the survey has examined is job satisfaction. Overall, 11% of respondents report being very satisfied with their job. In the Americas, that number is 22%. The other three regions, however, are much lower, with Europe at 8%, Middle East/Africa at 7%, and Asia at 4%.
The general pattern is that satisfaction increases with age. In Asia, it peaks at 17% in the 50 and over age group. Europe hits a high of 15% in the 40-49 age range and decreases slightly to 13% for those 50 and over. And the Middle East/Africa region has a high of 12% for those in their 40s.
The survey also asks respondents about specific factors that contribute to job satisfaction. These include questions about raises, hours worked, work-life balance, and desire to change jobs.
Raises
Similar to last year’s survey, two-thirds of respondents indicate they received a pay increase within the past year. Further, more than 80% have received a raise within the past two years. Most of those who haven’t received a raise expect one in the coming year.
The prospects for future raises appear to be good and fairly consistent among all the regions. More than three-quarters of the survey respondents (77%) believe that they are likely to receive a raise in the coming year. This is especially true for respondents in the Americas and Europe. The median expected raise in the coming year is 8%.
Of those respondents who received raises, the median raise was 8% (same as last year). Regionally, raises in the Asia and Middle East/Africa regions tend to be larger (with a median of 10%) than raises in the Americas (3.5%) and Europe (6%), but they happen less frequently and are smaller in absolute dollars.
Hours Worked
Survey respondents worked an average of 46 hours per week, which is exactly the same as reported last year. The Netherlands had the highest hours worked per week this year, averaging 49.1 hours (close to the average reported for last year’s “winner,” Germany, which had an average of 49.6 hours. This year, respondents in Germany reported an average of 46.2 hours). Rounding out the top three are India (48.6 hours) and the U.S. (47.7 hours). Respondents in Russia (41.6) reported working the fewest hours per week. None of the countries listed in Figure 1 reported an average of less than 40 hours of work per week.
Work-Life Balance
This year, respondents were asked a new question to assess their satisfaction with their work-life balance. Globally, 28% of all respondents said they were very or extremely satisfied with their work-life balance. Only 6% said they were very dissatisfied.
Satisfaction with work-life balance seems to mirror the overall job satisfaction results discussed earlier. Those in the Americas said they were the most satisfied with their work-life balance, with 47% of respondents very or extremely satisfied. Europe is second at 32%. Respondents from Asia reported by far the lowest satisfaction (13%), driven mostly by very low satisfaction in China. Those results are interesting given that Chinese respondents reported one of the lowest average-hour work weeks while U.S. respondents reported one of the highest.
In general, satisfaction with work-life balance tends to increase with age. The major exception is in the Americas, where satisfaction is relatively high in all age ranges.
Change Jobs
Thirty-three percent of respondents are looking to change jobs within the coming year. The percentage is highest in the Middle East/Africa region, where more than half (51%) are looking for an employment change. This isn’t surprising given the extremely low levels of compensation and the relative instability of the region. The most commonly stated reasons to move are to find a new career opportunity, improved salary, and improved quality of life.
In each region, the highest desire to change jobs occurs in the younger age brackets (20-29 and 30-39). This makes sense since those earlier in their career will likely have the most flexible lifestyle to accommodate a job change and tend to have the lowest job satisfaction.
Factors Affecting Satisfaction
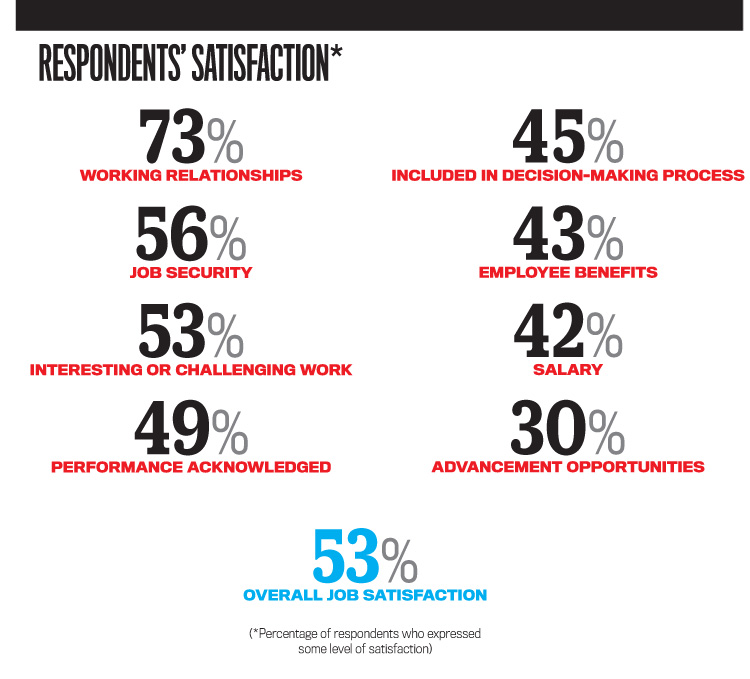
Respondents also rated how much various factors contributed to their career satisfaction in management accounting. The two factors rated most important were salary (92% of respondents said it was somewhat or very important) and employee benefits (90%).
But when asked to rate their level of satisfaction with these factors, only one other factor—opportunity for advancement—had lower results. For salary, 42% of respondents were very satisfied or more satisfied than dissatisfied. For employee benefits, it was 43%, and opportunity for advancement was 30%.
The attributes with highest satisfaction are consistent with previous studies: working relationships with others (73%), job security (56%), and how their employer handles ethical situations (54%). In terms of their importance to job satisfaction, however, these factors are relatively middle of the pack.
GRADUAL PROGRESS
Though the overall salary and total compensation levels are lower this year, there are still signs for optimism. More than three-fourths of survey respondents expect to receive a raise this year, with a median expected increase of 8%. And while there continues to be a significant gender pay gap, it is close to zero for those in the early stages of their career. Finally, the value of CMA certification continues to remain strong around the world, with CMAs reporting substantially higher salaries and total compensation than their non-CMA counterparts.
This is the second year of the expanded global salary survey. More information and analysis, including additional tables and figures, can be found in the full IMA Global Salary Survey report available at www.imanet.org/salary_survey. In the next few months, country or region-specific reports, such as for the United States, China, and others, will also be made available.
We sincerely appreciate members’ willingness to share their time and data with us. For that, we are truly grateful. Your continued support is essential as we strive to increase the value and relevance of the salary survey for IMA members.
March 2016


