ADD CALCULATED CONTROLS
Open the r_SalesCrosstab report in Design view. As you can see in the Group, Sort, and Total pane, the first group level is EOMSale by year, the second group level is EOMSale by quarter, and the information is sorted by EOMSale.
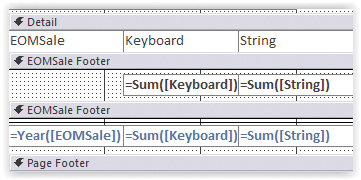
Figure 1 shows the sections of the report in Design view that display calculated total sales for the Keyboard and String categories by year and by quarter. We want to create controls that will contain the percentage calculations based on those sales values.

Select all the calculated controls in the EOMSale Footer for year. This can be done several ways, including by clicking in the footer’s section of the vertical ruler on the left of the Design grid or by clicking and dragging to touch the desired controls. Once all are selected, press Ctrl+C to copy. Then press Ctrl+V to paste a new set of controls directly below the original set.
NAMES AND FORMULAS
Next, update the new row of controls. Right-click on the first control and select Change To, Label. In the Property Sheet, set the Caption property to “% Year Sales.” This will be the label for our row of new calculations.
The rest of the controls (those appearing below the sums for each product category) will be used to represent the percentage of total sales for the section period (quarter, year, report) that come from each category (Keyboard, String, Percussion, etc.). This is calculated by referring to each control name containing the summary value we need to use. That’s why it’s so important to properly name controls. When new controls are created, Access assigns ambiguous names like Text91 or Label12. It’s up to you to create logical names, especially if controls will be referenced by other controls or code. When we want to use that value, we can refer to the control name in our new function rather than recreating that calculation.
Each control in the r_SalesCrosstab report that aggregates values is assigned a name derived from the function used, the product category, and the report section. For example, the control in the EOMSale Footer that calculates the quarterly sales for the Keyboard category is named “sumKeyboardQ” because it uses the Sum function and calculates the quarterly (Q) total (for the yearly total, it would be Y).
Because the record source for this report includes a field named “SumAmount”—note the capital S—the controls that aggregate values in the report are named with a lowercase s. For example, “sumSumAmountYr” is the name of a control that calculates a sum of the SumAmount field.
Following this naming convention, enter the following control names and equations in our new row of controls. They will calculate the percentage of overall sales that each product category represents:
* pcsumKeyboardYr: =[sumKeyboardYr]/[sumSumAmountYr]
* pcsumStringYr: =[sumStringYr]/[sumSumAmountYr]
* pcsumPercussionYr: =[sumPercussionYr]/[sumSumAmountYr]
* pcsumBrassYr: =[sumBrassYr]/[sumSumAmountYr]
* pcsumWindYr: =[sumWindYr]/[sumSumAmountYr]
The last column of the report includes all the product categories, and we want our new percentage control to express the sum of all products in that period as a percent of the level above it—in other words, the total sales of a quarter as a percentage of the year’s total and the total sales for a year as a percentage of the report’s grand total. Consequently, the name of the last control in this section is “pcYrtoGrand,” and the formula it contains is =[sumSumAmountYr]/[sumSumAmountRpt]. Note that this equation also references a calculated control in the report footer section, “sumSumAmountRpt.”
Select all of these new controls again and change their Format property to Percent. If you want, you can also set the Decimal Places property to an appropriate value.
UPDATE ALL SECTIONS
Following the same process, create calculated controls in the quarter and report footer sections. Here are the names and equations to use:
* pcsumKeyboardQ: =[sumKeyboardQ]/[sumSumAmountQ]
* pcsumStringQ: =[sumStringQ]/[sumSumAmountQ]
* pcsumPercussionQ: =[sumPercussionQ]/[sumSumAmountQ]
* pcsumBrassQ: =[sumBrassQ]/[sumSumAmountQ]
* pcsumWindQ: =[sumWindQ]/[sumSumAmountQ]
* pcQtoYr: =[sumSumAmountQ]/[sumSumAmountYr]
* pcsumKeyboardRpt: =[sumKeyboardRpt]/[sumSumAmountRpt]
* pcsumStringRpt: =[sumStringRpt]/[sumSumAmountRpt]
* pcsumPercussionRpt: =[sumPercussionRpt]/[sumSumAmountRpt]
* pcsumBrassRpt: =[sumBrassRpt]/[sumSumAmountRpt]
* pcsumWindRpt: =[sumWindRpt]/[sumSumAmountRpt]
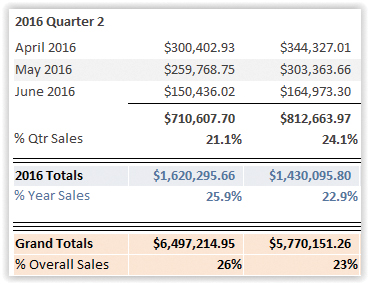
Figure 2 shows a section of the completed report in Report view with our new percentages. If desired, a pie chart (or other type of chart) could be created in each section to graphically show the percentages. To try this out for yourself, download the databases for this month: June_Databases_Percentages. Next month, we will create a form to act as a menu with command buttons to open reports and other objects.

SF SAYS
Along with Sum, other aggregate functions that can be used like this in group and report sections include Avg, Max, Min, and Count.

June 2016


