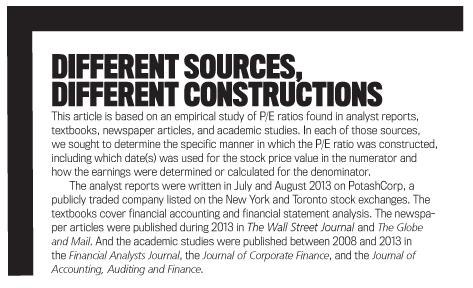
Because the P/E ratio is so common in the financial reporting community, you might expect that it is arrived at in the same manner every time it is used. But that isn’t the case. We looked at a number of different sources to see how the P/E ratio was constructed and to determine the different data used in the calculations (see “Different Sources, Different Constructions”). The number of variations and combinations used for the P/E ratio could have substantial implications for the various players in the financial reporting community.
STOCK PRICE VARIATION
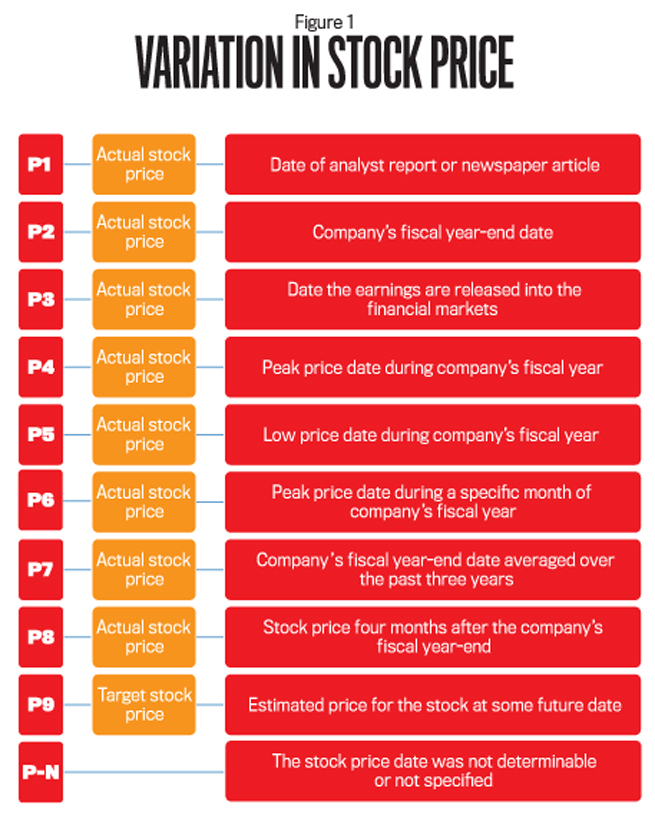
Our first step was determining the amount of variety. Figure 1 presents the variation that was found in the stock price (i.e., the numerator in the P/E ratio). We identified nine variants. The first eight used the actual stock price, with the variation coming from the different dates being used: (P1) the specific date the analyst report or newspaper article was written; (P2) the company’s fiscal year-end date; (P3) the specific date the company released its earnings into the financial markets; (P4) the peak and (P5) low stock price date during the full fiscal year; (P6) the peak stock price date during a specific month of the fiscal year; (P7) a three-year average price using the company’s fiscal year-end date; and (P8) the stock price exactly four months after the fiscal year-end. A ninth variation (P9) involved analysts using an estimated stock price at some future date when constructing the P/E ratio.
There were also a number of cases, commonly seen in the newspaper articles we reviewed, where we were unable to determine the stock price date with reasonable precision. And a number of textbooks—in particular, the introductory financial accounting textbooks—deliberately left the stock price date unspecified, simply using “price,” “stock price,” or the letter P to represent the numerator. These latter situations are shown as P-N in Figure 1.
EARNINGS VARIATION
Figure 2 presents the variation in the earnings measure (i.e., the denominator). We again found nine specific variants.
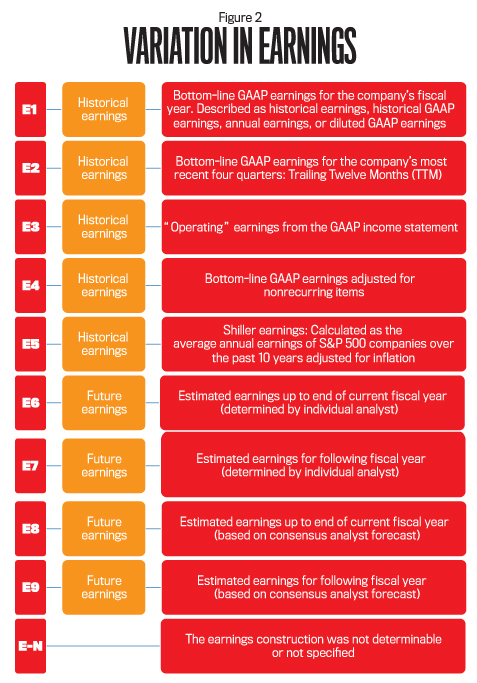
Five of these (E1-E5) used historical measures of earnings. E1 was the bottom-line earnings for the firm’s fiscal year determined using U.S. Generally Accepted Accounting Principles (GAAP). This was variously described using terms such as “historical earnings,” “historical GAAP earnings,” “annual earnings,” or “diluted GAAP earnings.” E2 was GAAP bottom-line earnings for the firm’s most recent four quarters preceding the date of the analyst’s report. This historical measure is often referred to as Trailing Twelve Months (TTM) earnings. E3 was the operating earnings measure as reported by the firm in its GAAP income statements.
The other two variants that used historical measures were a little more customized. E4 involved non-GAAP measures of the firm’s earnings as constructed by the analysts. These include adjusting a firm’s bottom-line GAAP earnings for various nonrecurring items, such as one-time gains or losses, or for non-cash expenses, such as amortization. And E5 is a unique construction attributed to Robert Shiller from Yale University. This measure averages a firm’s earnings over a 10-year period and adjusts it for inflation.
The second group of earnings measures used (E6–E9) were future-oriented (i.e., estimated). These are often referred to as forward earnings. In our study, they included estimates made by individual analysts as well as consensus estimates from across the analyst community. In both cases, we found that the estimates were for either the remainder of the current fiscal year or for the firm’s following fiscal year.
As with the stock price variations, there were a number of instances where we were unable to determine the specific earnings measure being used or it wasn’t specified. The culprits also were the same. It was common for it to be unclear what earnings measure was being used in newspaper articles, and a number of textbooks simply described the denominator as “earnings” or the letter E. These are listed as E-N in Figure 2.
PRICE-EARNINGS COMBINATIONS
Figure 3 shows the 29 different price-earnings combinations found in the study. Seventeen involve situations where both the numerator and denominator in the P/E ratio were fully identified. The first column includes the seven combinations that combined the stock price at the date of the analyst report or newspaper article with a specific historical or future earnings measure. Another three combinations used the stock price at the company’s fiscal year-end in combination with three different earnings measures.
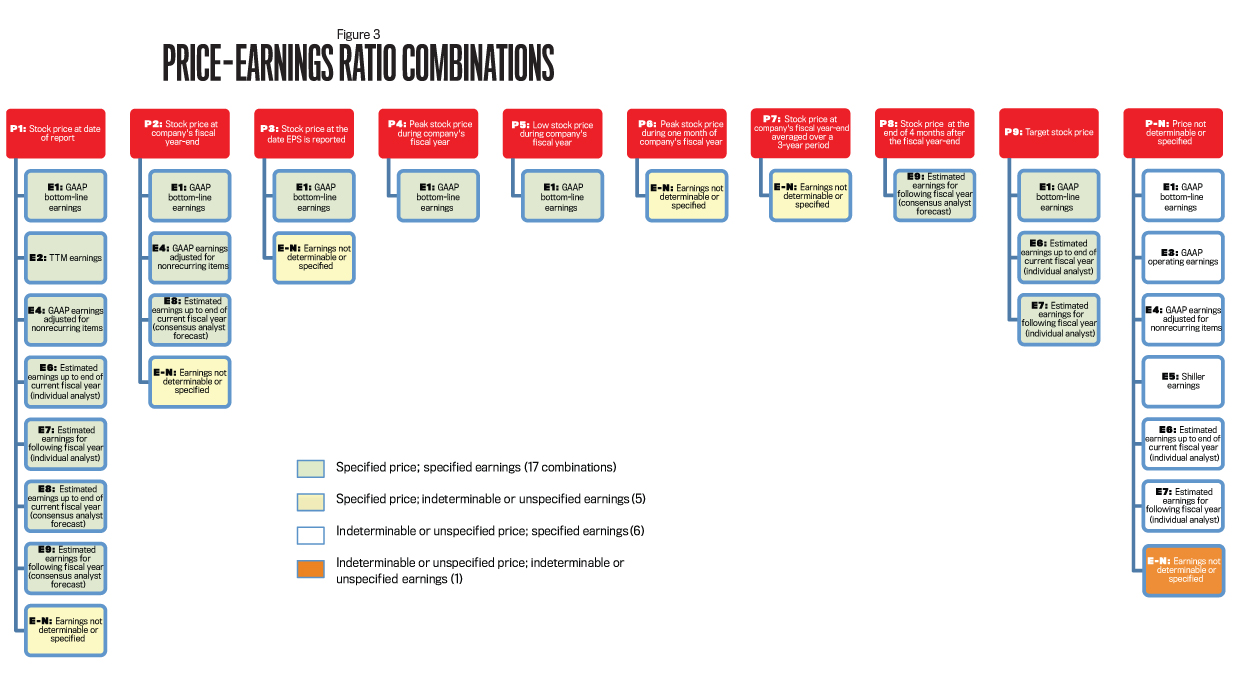
Eleven combinations involved ratios that included an unknown or indeterminable measure. The column to the far right shows six situations where an indeterminable or unspecified price was used with a specified earnings measure. Conversely, there were five cases where a specified price was linked with indeterminable or unspecified earnings.
Finally, as can be seen at the bottom of the right-hand column, there were cases where neither the stock price nor the earnings measure was determinable or specified. We also identified some analyst reports where the earnings measure was denominated in U.S. dollars while the price measure was in Canadian dollars. Those weren’t included in the analysis.
WHY THE VARIATION?
Why does so much variation exist in the construction of the P/E ratio? The simple explanation is that, like other financial analysis tools, the P/E ratio is neither formally regulated nor is there a standard, agreed-upon construction. In other words, the ratio is simply a tool created to help perform financial analysis—most notably, to help make (or perhaps justify) investment decisions.
Different versions of the ratio will be used depending on the specific objective for its use. For example, analysts interested in examining P/E ratio volatility over a period of time will use the highest and lowest stock prices during that specified period to construct their ratios. At the same time, analysts or news reporters interested in providing a more current analysis will use the most recent stock price at the date of the report or article. And valuation heuristics may differ between individual analysts or investment firms, leading to the use of different measures in the ratio.
Meanwhile, academics searching for answers to different research questions may introduce or require different specifications for the P/E ratios based on the empirical models used in their studies, while financial columnists and media experts may use different variations to best tell their story or to help convince the public that their investment models and stock recommendations are valid.
IMPLICATIONS OF THE VARIATION
What about the implications from such variation in the P/E ratio construction? As we noted in the beginning, the P/E ratio is commonly used for making stock recommendations, among other decisions. We believe that only through a full appreciation of the differences in construction can informed decision making be ensured.
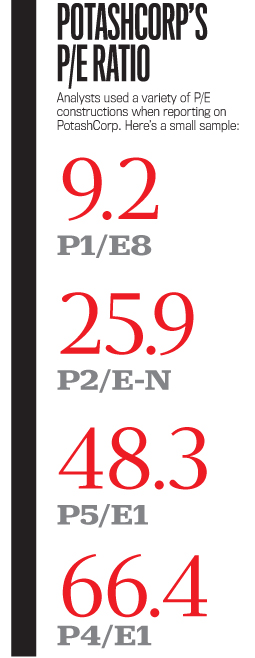
For example, the analyst reports on PotashCorp used P/E ratios that range from a low of 9.2 to a high of 66.4. This significant range of multiples can be traced to different specification of the price and earnings variables used in the construction of the ratio. If you were someone trying to make an investment decision regarding PotashCorp, knowing how the various P/E ratios were constructed would give you a better understanding of the company’s financial condition, whereas not knowing they were different could lead you to make incorrect, and possibly costly, assumptions or determinations.
For company management, it’s important to be aware of the actual constructions when reviewing or commenting on analyst reports of the company or when comparing the company’s earnings multiples to comparable firms. Such awareness is also important if performance evaluation incorporates the P/E ratio as part of the assessment mix.
For business writers, we suggest full disclosure of how the P/E ratios are constructed so that readers can become better informed consumers of business information. We also recommend that the academic research community become more aware of the various constructions to ensure their studies consider the full range of P/E ratios as potential variables of examination.
Finally, we believe that accounting educators have a special responsibility to become fully aware of the variation. This will ensure their textbooks and other teaching materials lead to better informed—and ultimately stronger—future accounting professionals.
AWARENESS IS VITAL
Ultimately, the extensive variation in the construction of P/E ratios in practice demonstrates that companies don’t have a single, standard P/E value. The number can change depending on the context in which the ratio is being calculated and the purpose or intended goal of the individual constructing it. That’s why we believe it’s extremely important for all participants in the financial markets—analysts, managers, investors, business writers, researchers, and educators—to become fully aware of this variation. Doing so will lead to greater sophistication of decision making and enhance the future efficacy of the financial markets.

November 2015


