EMPLOYEES WHO STRUGGLE WITH SUBSTANCE ABUSE MOST COMMONLY DEMONSTRATE:
74%
ABSENTEEISM
61%
POOR JOB PERFORMANCE
33%
INAPPROPRIATE INTERACTIONS WITH COWORKERS
28%
THEFT
For more survey results, go to the new IMA Pulse blog at http://bit.ly/1Rkavah.
There are two complementary variations of XBRL. The one most people are familiar with is XBRL for Financial Reporting (XBRL FR), which is used to codify the financial information used for external reporting, such as financial statements and regulatory reports. Several national authorities require companies to provide financial statement information in XBRL FR format. In the United States, for example, all Securities & Exchange Commission (SEC) filers have to prepare their financial statements in interactive data format using XBRL.
The other variation, XBRL GL, is a taxonomy used to standardize the information necessary for any internal use, such as control and decision making, and for exchanging information with external stakeholders. In other words, XBRL GL provides a way to standardize all the granular information stored in enterprise resource planning (ERP) applications, accounting, and operational software.
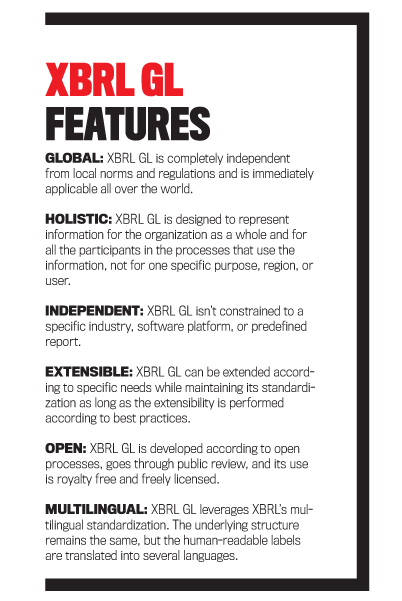
The combined use of XBRL GL and XBRL FR links the single operational tasks with the end reports and allows users to drill down from the report to the underlying details, avoiding loss of information and supporting a complete audit trail. It also enables the creation of standardized business rules and controls that are applied consistently to data stored across different applications. This enhances data quality and supports continuous auditing and data monitoring. (See “XBRL GL Features” for a summary of the main features of XBRL GL.)

REPRESENTING INFORMATION
The generic components and structure of XBRL GL allow for the representation of all the information stored in your company’s ERP, accounting, and operational systems, including master files, setup files, transaction files, reference files, and more. It’s also possible to speed up and improve the consolidation process by creating mappings between different charts of accounts.
But the potential of XBRL GL isn’t limited to financial data. It also extends to nonfinancial data. Examples of information that can be represented with XBRL GL include:
- Information about people and companies, such as customers, suppliers, employees, and other subjects or entities;
- Information about measurable items involved in the business process, such as inventory, fixed assets, key performance indicators (KPIs), and intangibles;
- Information about the identification of business documents, such as document number, issue date, and registration date;
- Information about entries, such as account, description, and typology; and
- Job costing information, including detailed information about costs and time.
MAIN ELEMENTS OF XBRL GL
The XBRL GL taxonomy is organized in a hierarchical structure. Understanding it is crucial for creating valid and reliable instance documents. The root element is called Accounting Entries and contains three nested structures: Document Information, Entity Information Section, and Entry Information.
Document Information includes the elements used to specify date, language, currency, and other key identifiers of the instance document. One of the most important tags within Document Information is Document Type, which specifies the type of information represented by the instance. It can have the following values: account, balance, entries, journal, assets, trial balance, tax tables, and other. This enables a computer to immediately interpret the content of the instance document without human intervention. For example, it can tell if it’s a chart of accounts, a list of assets, a journal, and so on.
Entity Information Section includes information about the company that is the subject of the document, such as contact information, the e-mail address structure, business description, the accounting method structure, fiscal year start and end, and so forth.
Entry Information includes the majority of the tags and the most relevant information. Two examples are the Account and Measurable structures. The Account structure is used to represent accounts without depending on local accounting principles or national definitions. One crucial tag used to define what is represented with Account is Account Type. It can have the following values: account, bank, employee, customer, job, vendor, measurable, statistical, and other. The Measurable structure is used when data about inventory, assets, or employees is expressed in qualitative or quantitative terms rather than monetary amounts. Examples include size, color, and quantity, which are detailed data fields often included in certain internal reports. This shows the flexibility of XBRL GL in representing the variety of company data.
One peculiar and powerful characteristic of the GL taxonomy is the SRCD (Summary Reporting Contextual Data) module, which was developed to associate the information contained in XBRL FR instance documents with the detailed data represented with XBRL GL. XBRL FR doesn’t include tools or capabilities to link summary information with the underlying detailed data. By using the SRCD module, it’s possible to drill down from the summary report to the source data, avoiding the loss of information that traditional reports have.
IMPLEMENTATION PROCESS
The process of creating a business report in XBRL GL format involves three steps (see Figure 1):
- Download and explore the taxonomy,
- Map source data to XBRL GL, and
- Create the instance document.
The underlying logic of the process is the same as using XBRL FR to generate a filing, such as for the SEC, but there are some peculiarities that make the XBRL GL process different.

1. Download and explore the taxonomy.
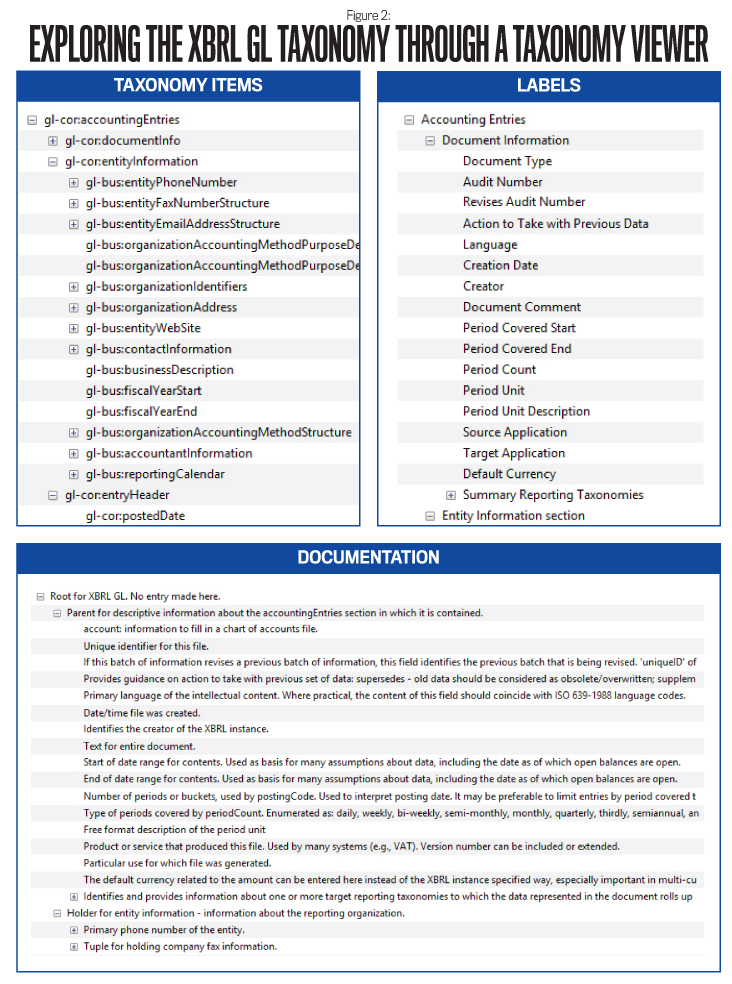
The first step is to download and familiarize yourself with the XBRL GL taxonomy. An XBRL taxonomy is often compared to a dictionary because all the concepts useful for a business report are listed, classified, and described. Additional documentation is also associated to the items, as are multilingual text labels, which are useful for translating the reports into a human-readable format.
While the taxonomies used to create XBRL financial statements or other types of summarized end reports are only applicable to a certain jurisdiction, XBRL GL is adopted all over the world (it is, after all, a Global Ledger). Furthermore, XBRL GL is a much smaller taxonomy, made of generic and reusable items.
The most up-to-date version of the taxonomy is published and distributed for free on the XBRL International website (http://specifications.xbrl.org/spec-group-index-xbrl-gl.html). On March 25, 2015, the XBRL Standards Board approved the latest stable version (or “recommendation”).
After downloading the package, you will have a directory with a series of subfolders, which are the modules of the taxonomy. In addition to the basic COR (Core) module, there are modules such as BUS (advanced Business Concepts), MUC (MultiCurrency), USK (U.S. and U.K. accounting), TAF (Tax Audit File), and SRCD (Summary Reporting Contextual Data). A complete taxonomy is obtained by assembling the required modules together according to the specific purpose, but an in-depth examination of all the files composing the taxonomy is reserved for developers.
As a management accountant, you should limit your exploration to the PLT (Palette) folder. A palette schema combines the modules based on your information needs. For example, the palette case-c-b-m combines the COR module with the BUS module and the MUC module. By using a taxonomy viewer, such as the open-source Arelle or Altova’s XMLSpy, it’s easy to explore the items composing the taxonomy structure with the associated text labels and descriptions (see Figure 2).
 Click image to enlarge
Labels and descriptions are available in multiple languages. In addition to English and Japanese, which are included in the latest taxonomy, complete translations are available for Spanish, Italian, Brazilian Portuguese, and Chinese. Partial sets are available for Finnish, Canadian French, and Turkish. You can open your desired taxonomy by deciding the right palette schema and selecting as entry point the file called gl-plt-all-[date].xsd as the entry point.
2. Map source data to XBRL GL.
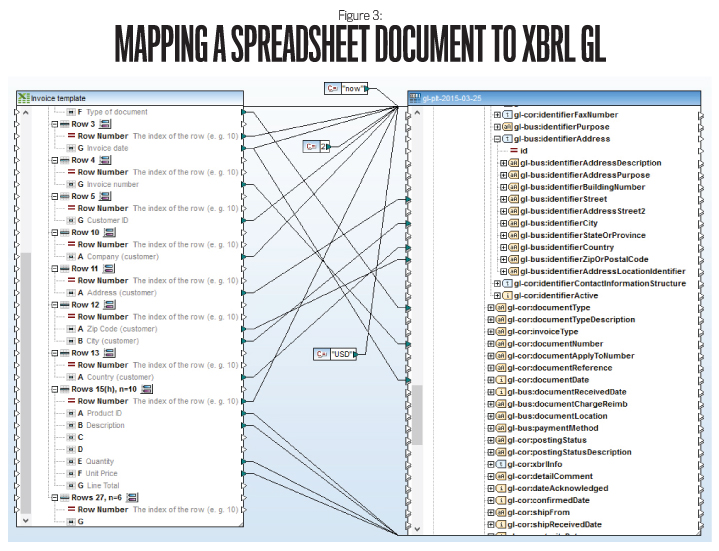
The second step of the implementation process involves mapping the source data to the appropriate items in the taxonomy. In this step, the relevant corporate information is matched to the items (also called tags) of the XBRL GL taxonomy. The challenge is in properly matching the specialized data fields of your source systems to the generic taxonomy items. But don’t worry—the learning process is faster compared to the extensive taxonomies used for financial reporting with XBRL FR.
Specific software packages, such as Altova’s MapForce or any other mapping tool with XML/XBRL capabilities, can assist the process by providing an intuitive graphical interface and drag-and-drop capabilities (see Figure 3). A short mapping demo video focused on mapping from a database table to XBRL GL taxonomy can be found at http://iphix.net/iresources/xbrl-mapping-demo.
 Click image to enlarge
3. Create the instance document.
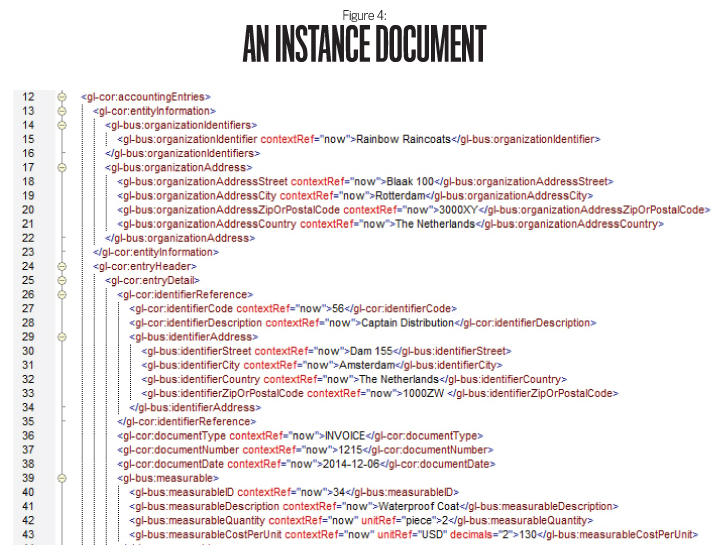
The last step concludes the process by creating the instance document, which is the digital end report or business document that contains the source data. This step is totally automated and based on the mapping created in Step 2. The final document is computer-readable without depending on a specific software platform. For example, XBRL GL instances can be viewed and manipulated using spreadsheet software, such as Microsoft Excel. With XBRL-compatible software, it also can be visualized in a human-friendly format (see Figure 4).
 Click image to enlarge
IMPLICATIONS FOR MANAGEMENT ACCOUNTANTS
In the past, information systems software packages were seen as black boxes managed and configured by IT professionals. Management accountants, in their traditional roles, were unaware of the way in which the application processed the data. For some tasks, they were accepting at face value the information they were given.
Over the past decade, however, the standardization of accounting practices, the increasing need for data integration, and the management of new accounting information systems have all contributed to the evolution of the management accountant. Today’s management accountant needs to have competencies pertaining to both financial accountants and IT professionals. This new hybrid role has eroded the boundaries of the profession, incorporating new skills and competencies and increasing the interface with the line functions.
The development of XBRL—and XBRL GL in particular—supports this new role. XBRL further enhances data access, the consolidation of different sources of data, and the analysis of company information. In addition, management control and decision making are facilitated through accessible and dynamic internal reports created in real time and directly related to external reports.
The evolution of corporate reporting with the adoption of XBRL GL encourages the hybridization of the management accountant in at least three ways. First, there is the increased involvement in tasks traditionally reserved for IT professionals. The mapping of XBRL GL data, codifying and decoding data, generating instance documents, and using advanced tools of analysis are tasks that require appropriate skills. Many of these tasks can’t be performed by a pure accountant or a specialized IT person—a combination of the two skill sets is becoming necessary.
Second, the functions assigned to management accountants are increasing in number and variety of content. Even in fields generally outside the accounting competencies, management accountants act more as consultants, and they intervene in the less-routine accounting tasks when the automated system isn’t enough. XBRL GL acts as an enabler of these new roles.
Third, in association with the broader competencies, management accountants provide increased and more structured support for managerial decision making. The data they prepare for managers is provided in a way that reduces the need for subsequent interpretation and speeds up the decision process. Management accountants act as filters to suggest the best actions and solutions for the company. This role is helped by XBRL GL, which enables consolidation of data from multiple sources with little effort while avoiding redundancy. At the same time, XBRL GL’s platform independence allows the information to be virtually centralized where users need it even though the different sources of information are physically decentralized.
For management accountants, XBRL GL provides enhanced opportunities for data analysis and elaboration. The ability to codify quantitative, qualitative, and monetary data according to a specific and computer-interpretable taxonomy makes it possible for the same data fields to be used for more than one purpose and for different analyses, avoiding the need for retyping and reducing the risk of mistakes. XBRL GL reduces the redundancy of information and eliminates superfluous data and sources of error by excluding calculated fields.
The ability to manage many kinds of information creates the opportunity to generate multidimensional reports and to use sophisticated data analysis methods for advanced business reporting. XBRL GL overcomes the presence of different legacy systems that aren’t able to interface with each other and exchange information. Data mapping reduces the need for manual integration of information and facilitates the generation of real-time reports, increasing the advent of continuous reporting. This new way of creating reports enhances the support of decision making and can be a source of competitive advantage.
Market data and benchmarks codified with XBRL GL can be integrated into a company’s analyses without additional effort. Management decisions are made faster and are based on a greater number of information sources. Further, the possibility to represent qualitative information provides the opportunity to develop a complete system of KPIs to measure performance or to develop a balanced scorecard.
Cost and profitability analysis can be improved by extracting the time periods of the activities from the information systems. The mapping procedure applied to time data reduces the implementation complexity of costing methods, such as activity-based costing (ABC) or time-driven ABC, and improves the analysis of costs and performances.
A standardized language such as XBRL GL facilitates the transmission and the compatibility of data among different subsidiaries, entities, and companies, creating an integrated and ubiquitous system of information exchange. Data is immediately available everywhere and can be processed with different tools. Even the use of different proprietary accounting information systems by different organizational units is an obstacle to budgeting consolidation, which can be solved with the adoption of XBRL GL. Complex scenario analyses and rolling forecasts are possible without wasting time, as are comparisons between budgeted and actual results.
The interface between XBRL GL and XBRL FR makes it easy to relate summary financial, tax, and statutory reports, simplifying the procedures used to generate reports. And the bridge between transaction and end reports enables on-the-fly report modification according to specific information needs and to reach a deeper level of analysis when required.
All in all, the possibilities of XBRL aren’t limited to the preparation of financial statements. With XBRL GL, management accountants can reap all the advantages of a global, standardized language for business reporting to improve internal—as well as external—reporting and enhance decision making.

October 2015


