THE QUERIES
TOTAL ASSETS Create a query using the Balance Sheet table as the data source. Save it as “Total Assets.” In the first field, enter Year:2015. For the second field, drag down Group1 from the table. Set the Criteria to “Assets.” The third field is Assets:Amount. This tells the query to use the data from the Amount field and to label the column as Assets. From the Design ribbon, click the Totals button to make that line visible in the query design grid. Change the Total of the third field to Sum (see Figure 1). Test the query, then save and close it.
TOTAL LIABILITIES AND STOCKHOLDERS' EQUITY
This query is very similar to the first. Create a query using the Balance Sheet table as the data source and save it as “Total Liabilities and Stockholders’ Equity.” The first field is Year:2015. For the second field, bring down Group1 from the table and set the Criteria to “Liabilities and Stockholders’ Equity.” The third field is Liabilities and Stockholders’ Equity:Amount. Click the Totals button, and change the third field’s Total line to Sum. Test, save, and close the query.
COMBINE THE DATA
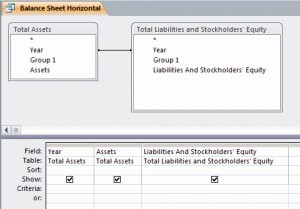
Create a query using the Total Assets query and the Total Liabilities and Stockholders’ Equity query as data sources. Save it as “Balance Sheet Horizontal.” When linking data together in multiple queries, there needs to be a common element in the two data sets. In this example, it’s the year. Link the two data sources by dragging the Year field from Total Assets to Total Liabilities and Stockholders’ Equity. To build the query, drag the Year field from Total Assets into the query design, followed by the Assets field. From the Liabilities and Stockholders’ Equity source, drag the Liabilities and Stockholders’ Equity field to the query design (see Figure 2). Run, test, and save the query.
We now have the data source for our report. From the Create tab, click on the Report Wizard button. In the Tables/Queries dropdown, select Query: Balance Sheet Horizontal. Add the fields you want to the Selected Fields, and then complete the remaining steps of the wizard and tweak the results to get your desired layout. Whenever you open the report, it will run the Balance Sheet Horizontal query, which ensures it always uses the latest data from the other two queries.
GETTING YOUR DATA
MULTIPLE QUERIES
The different data sets that you want to present together need to have a common link. In the previous example we used the year. But you can also get more specific with dates. For example, if you have one table with payments by date and another with deposits by date, you can follow the same process we did here to create three queries that will ultimately show payments and deposits side by side, grouped by date. Other possible linking options you might encounter would be things such as a product name or an account number. The point is that the category needs to exist in each of the query data sources you want to combine.
FIND THE RIGHT STRATEGY
Whether you build the data by creating a series of append queries, as we have in the past, or create several queries that work together, don’t give up. In the 30 years I have been working with Access, I have yet to find a situation in which I couldn’t get the data together to fulfill the requirements for a report. Sometimes it takes creativity, trying multiple ideas, or discussing it with someone else. Feel free to e-mail me if you would like some suggestions to bring together the data you seek.
Download this month's database here: SF_APR_2015.
SF BEST PRACTICES
If you can’t get the data you want using one query, try combining two or three queries to get the result you need.
April 2015


